
Today's release of Notebooks provides entirely new analytics capability for your Losant applications. Losant Notebooks are the fully integrated execution of Jupyter Notebooks against your application data. Prior to this release, Losant was primarily suited for the real-time stream processing of your device data. With Notebooks, you can now perform complex batch analytics on historical datasets to derive entirely new kinds of insights.
Batch Analytics for IoT Data
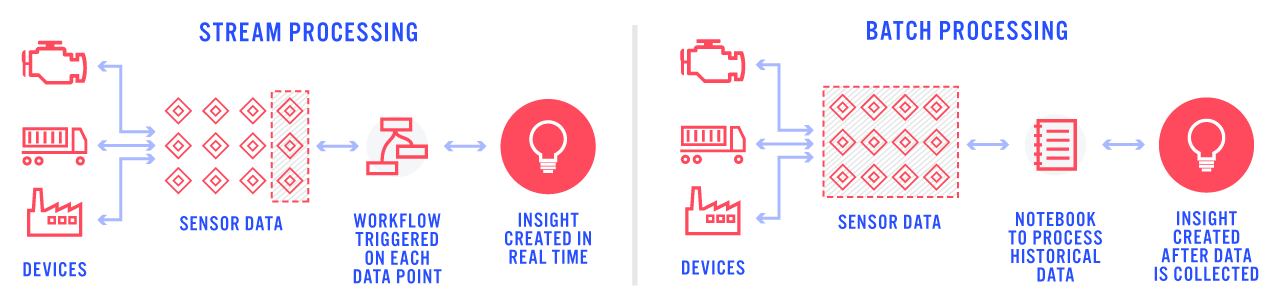
Real-time stream processing, powered by our Visual Workflow Engine, has been at the core of our platform since day one. This functionality has enabled our customers to quickly deliver IoT solutions that act, alert, and notify in real time as devices report data. However, as our customer base grew we began to notice that some IoT solutions require more than just real-time processing. Some applications collect sensor data over a period of time, from thousands or tens of thousands of devices, and then require batch processing to calculate the required result. Implementing these applications in Losant was difficult and usually required additional tools.
Based on our conversations with customers utilizing batch analytics, we saw that Jupyter Notebooks were a popular choice to help provide these types of solutions. We then spent months interviewing customers, data scientists, and our own internal solutions team to figure out everything required to bring notebooks into the Losant Platform.
Seamless Integration
One of our product goals and main differentiators is that every feature we release is fully integrated into the rest of the Losant Platform. When compared to utilizing the major cloud vendors directly, which are composed of many disparate services, we've seen a significant reduction in time-to-market and reduction in solution complexity. We could have offered a hosted Jupyter runtime and called it a day. In fact, several cloud vendors have done exactly that. This leaves you with a significant amount of complexity when it comes to getting your IoT data into your notebook and utilizing the results in your application's business logic.
Losant solved this challenge by seamlessly integrating your IoT data with your Jupyter Notebooks. Data inputs, which can be device data, data table data, or custom data from external URLs, is automatically queried, downloaded, and made available to your notebook when it executes in our secure, managed environment. Result data that your notebook generates- which could be image files, CSV datasets, and many others- are automatically pulled back into Losant and stored in Losant Files or Losant Data Tables.
We've also integrated Notebooks into our Visual Workflow Engine with the addition of the Notebook Trigger and Notebook: Execute Nodes. These provide a way to build powerful data processing pipelines with recurring and scheduled notebook executions.
Working with Notebooks
This walkthrough shows a simple example of how Losant Notebooks can be used to derive insights that would be very difficult to do prior to this release. Occupancy monitoring within smart environments has been a popular use case for our enterprise customers who are building and renovating their corporate campuses. Whereas our custom chart block can visually represent some occupancy aggregations over a period of time, you can't use that to generate a useful dataset of the most active or least active times. Having that data in a "machine-readable" form allows you to do automatic scheduling of maintenance during inactive times, or even control HVAC for comfort and energy savings. This walkthrough will show how to use Losant Notebooks to derive this information from existing occupancy data.
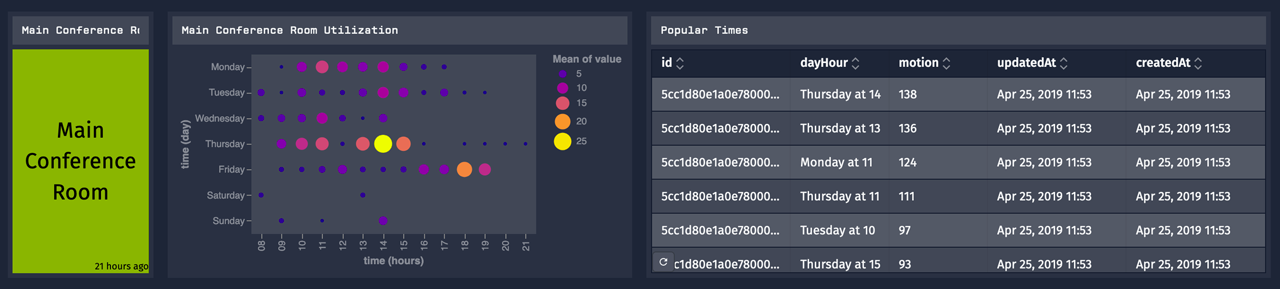
First, here's the end result of what I'm building. It shows the visual aggregation of the most popular days and times on the left with a sorted table on the right. The table on the right is created using Losant Notebooks.
Losant Notebooks do not provide interactive Jupyter sessions like you might have seen with other services. Losant Notebooks work more like scheduled jobs, where an already written notebook is periodically executed against your defined data inputs. Each time the notebook executes, all of the data is re-queried and provided to the notebook. This is because your devices are constantly reporting new data and a common use case is to re-process on a periodic interval with a historical dataset that includes the most recently received data. Creating a Losant Notebook involves five steps, which are outlined below.
Step 1: Configure Inputs
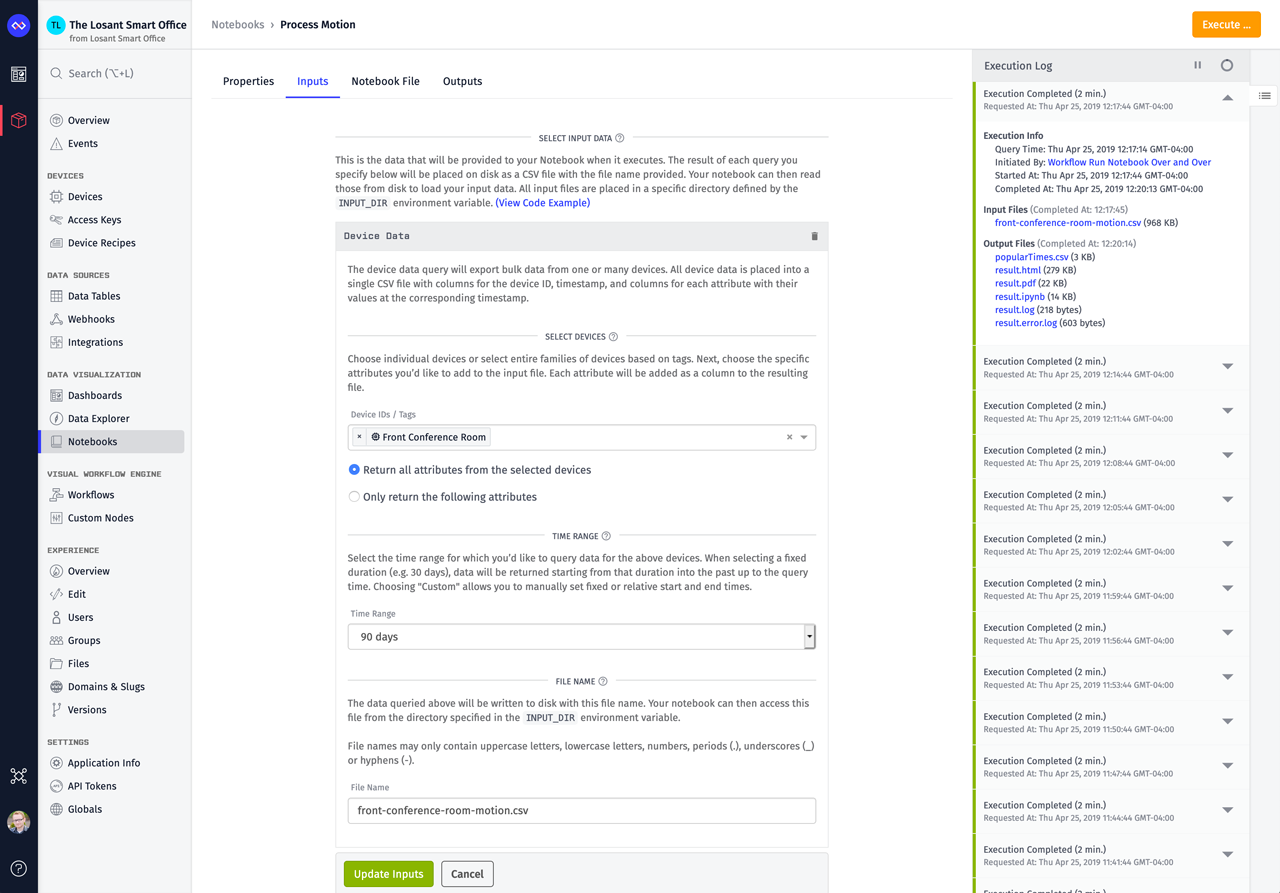
The first step in creating a Losant Notebook is to configure the input data that will be made available to the notebook when it executes.
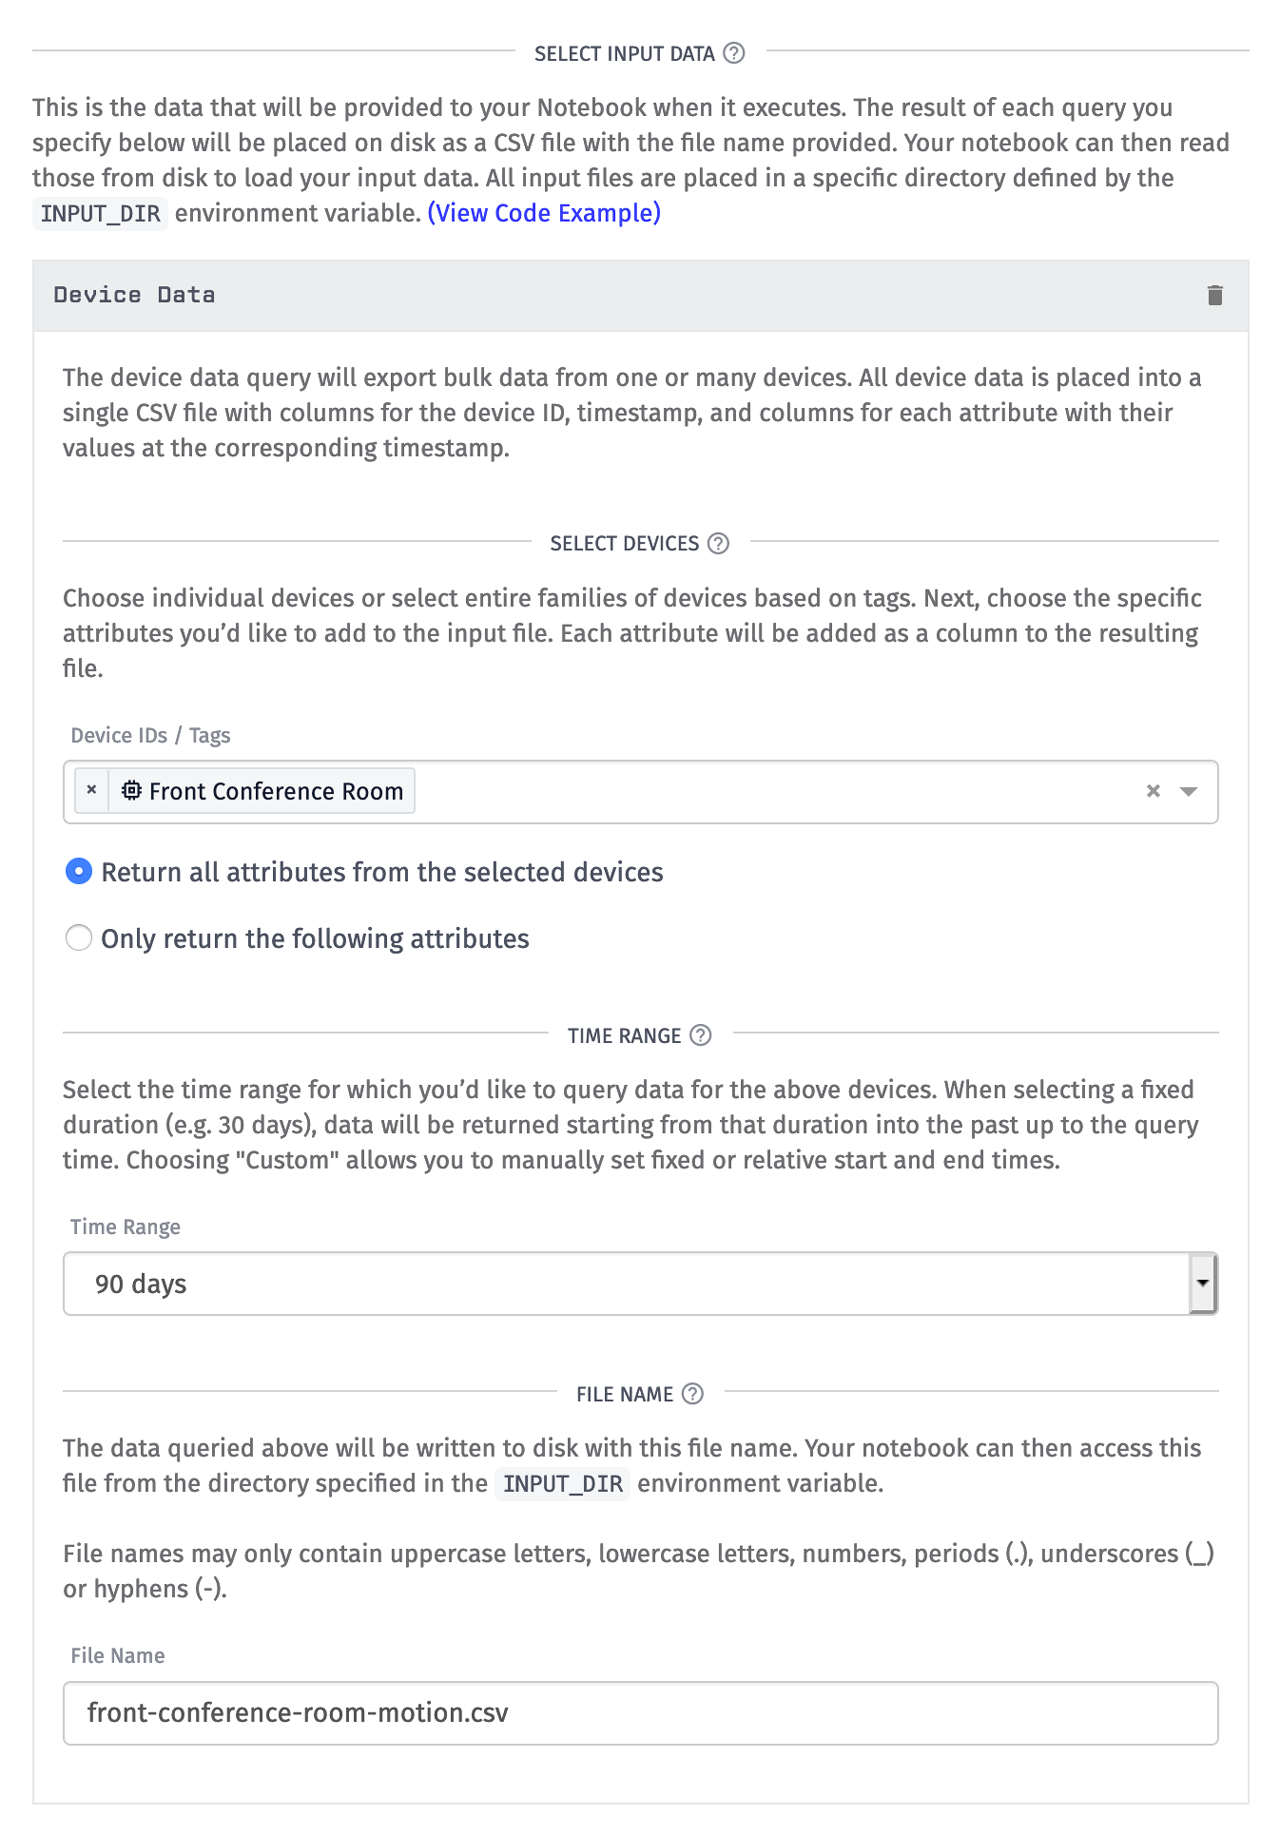
There are several types of data you can input, but for this walkthrough I need the motion sensor data from my "Front Conference Room" device. I then select the most recent 90 days of data and specify the file name to be "front-conference-room-motion.csv". Inputs control which data will be queried and made available to your notebook when it executes in our managed environment. It does this by downloading the data and writing it to disk next to your notebook at the file name you provided. When your notebook executes, it can read that data from the directory specified by the INPUT_DIR environment variable.
Step 2: Request a Data Export
Losant does not provide an authoring environment for writing the Jupyter Notebook itself. This means you'll need to request a data export so you'll have some example data to work with. The data you receive will be in the exact same format that your notebook will see when executing in our environment.
Once you've configured all required inputs, click the Request Data Export button at the bottom of the Inputs tab.
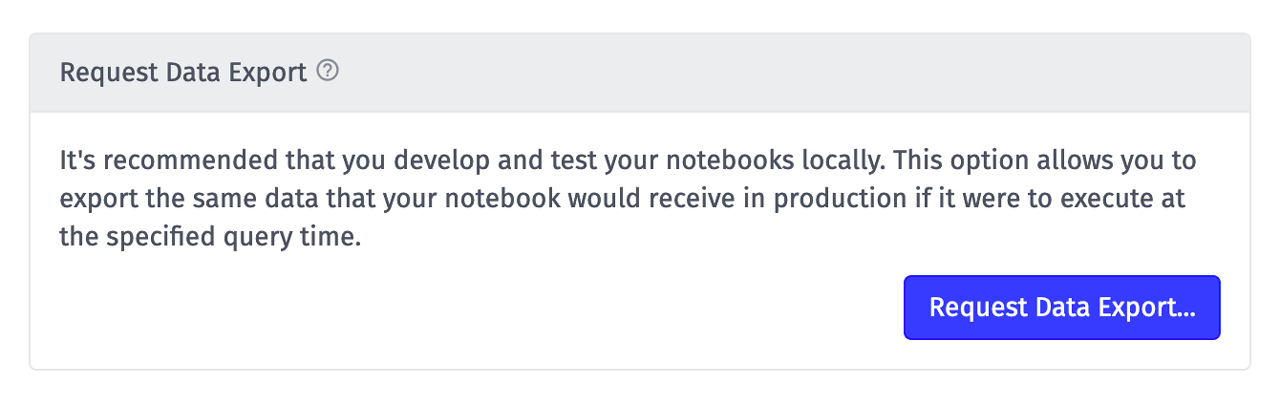
This will display a popup with additional options.
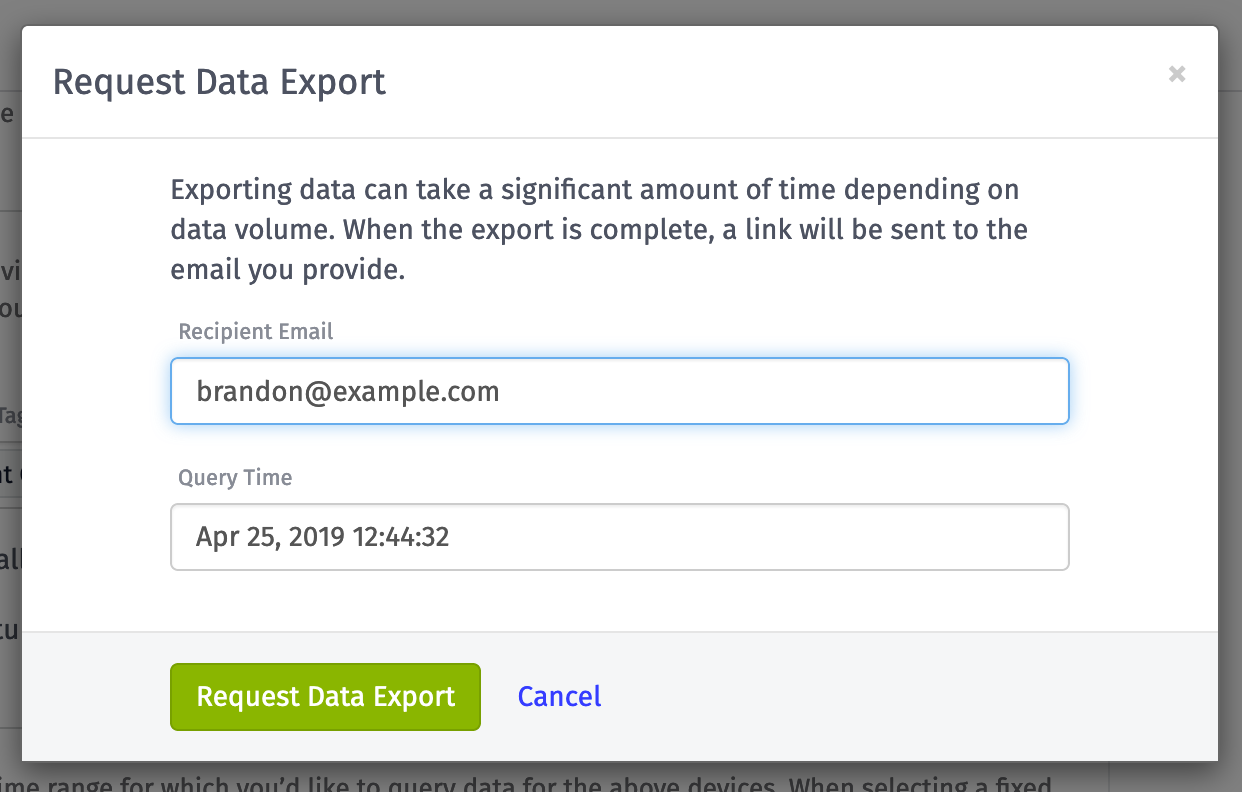
Since a data export can take a while, we will email the specified recipient with download links to their exported data. The Query Time lets you change the anchor point against which your device data is queried. In the example above, I'm querying 90 days of device data. By default, the query time is equal to the current time, so I'm querying the most recent 90 days of data. However, I could change the query time to allow me to query 90 days relative to some point in the past.
Step 3: Build Notebook Locally
Now that you have some data to work with, you can use any Jupyter environment you like to build and test your notebook. For this example, I ran Jupyter on my local computer. There are several cloud-based Jupyter environments you could use as well. Our Notebook Writing Guide contains lots of useful information on how to write a notebook that will be compatible with our platform.
Our execution environment runs Jupyter Notebook v5.7.8 with Python 3.7.3. When developing locally, it's recommended to run the same versions to ensure compatibility. You can see these and all other available libraries on our execution environment documentation.
When notebooks are executed in our environment, they must be configured to read data from the directory specified by the INPUT_DIR environment variable. When running locally, you can provide those same environment variables by using the following command when running Jupyter Notebook.
INPUT_DIR=$(pwd) OUTPUT_DIR=$(pwd) jupyter-notebook
The above command will set INPUT_DIR and OUTPUT_DIR to your current directory. If you place your exported data files into that directory, the notebook you create should work the same both locally and in our environment when it comes to reading and writing files. If you don't have access to environment variables, you'll just have to make sure to adjust your code prior to uploading the notebook to our platform.
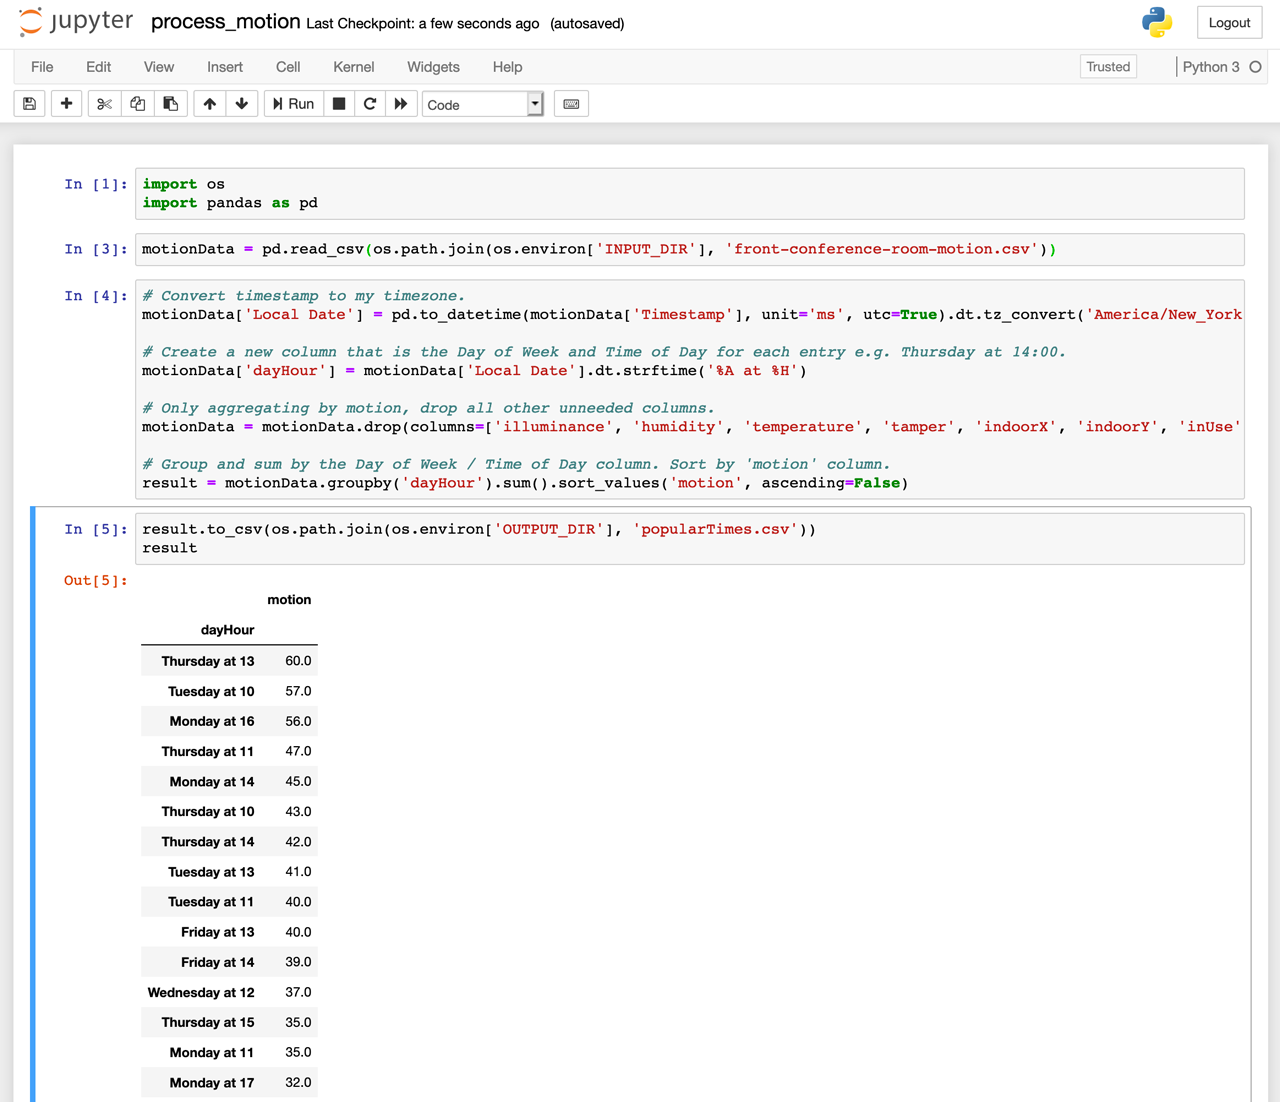
My entire notebook is above. I won't cover the details because everyone's notebook will be different and extremely specific to the insights you're trying to derive. However, it is important to point out the cells that are reading and writing data:
motionData = pd.read_csv(os.path.join(os.environ['INPUT_DIR'], 'front-conference-room-motion.csv'))
result.to_csv(os.path.join(os.environ['OUTPUT_DIR'], 'popularTimes.csv')
This is how data gets in and out of your notebook when executed in our environment. Every input you specify will be downloaded and available in the directory specified by the INPUT_DIR environment variable. If your notebook creates any results that you'd like to make available back to Losant, you'll need to save to those as files in the directory specified by the OUTPUT_DIR environment variable. In my example, I'm outputting a CSV file that contains the most active times in this conference room.
Step 4: Configure Outputs
Now that my notebook is generating output files and saving them into the directory specified by the OUTPUT_DIR environment variable, I can instruct Losant to do something with that data. I can either save it into Files or a Data Table. In this example, I want the results to be saved into a Data Table.
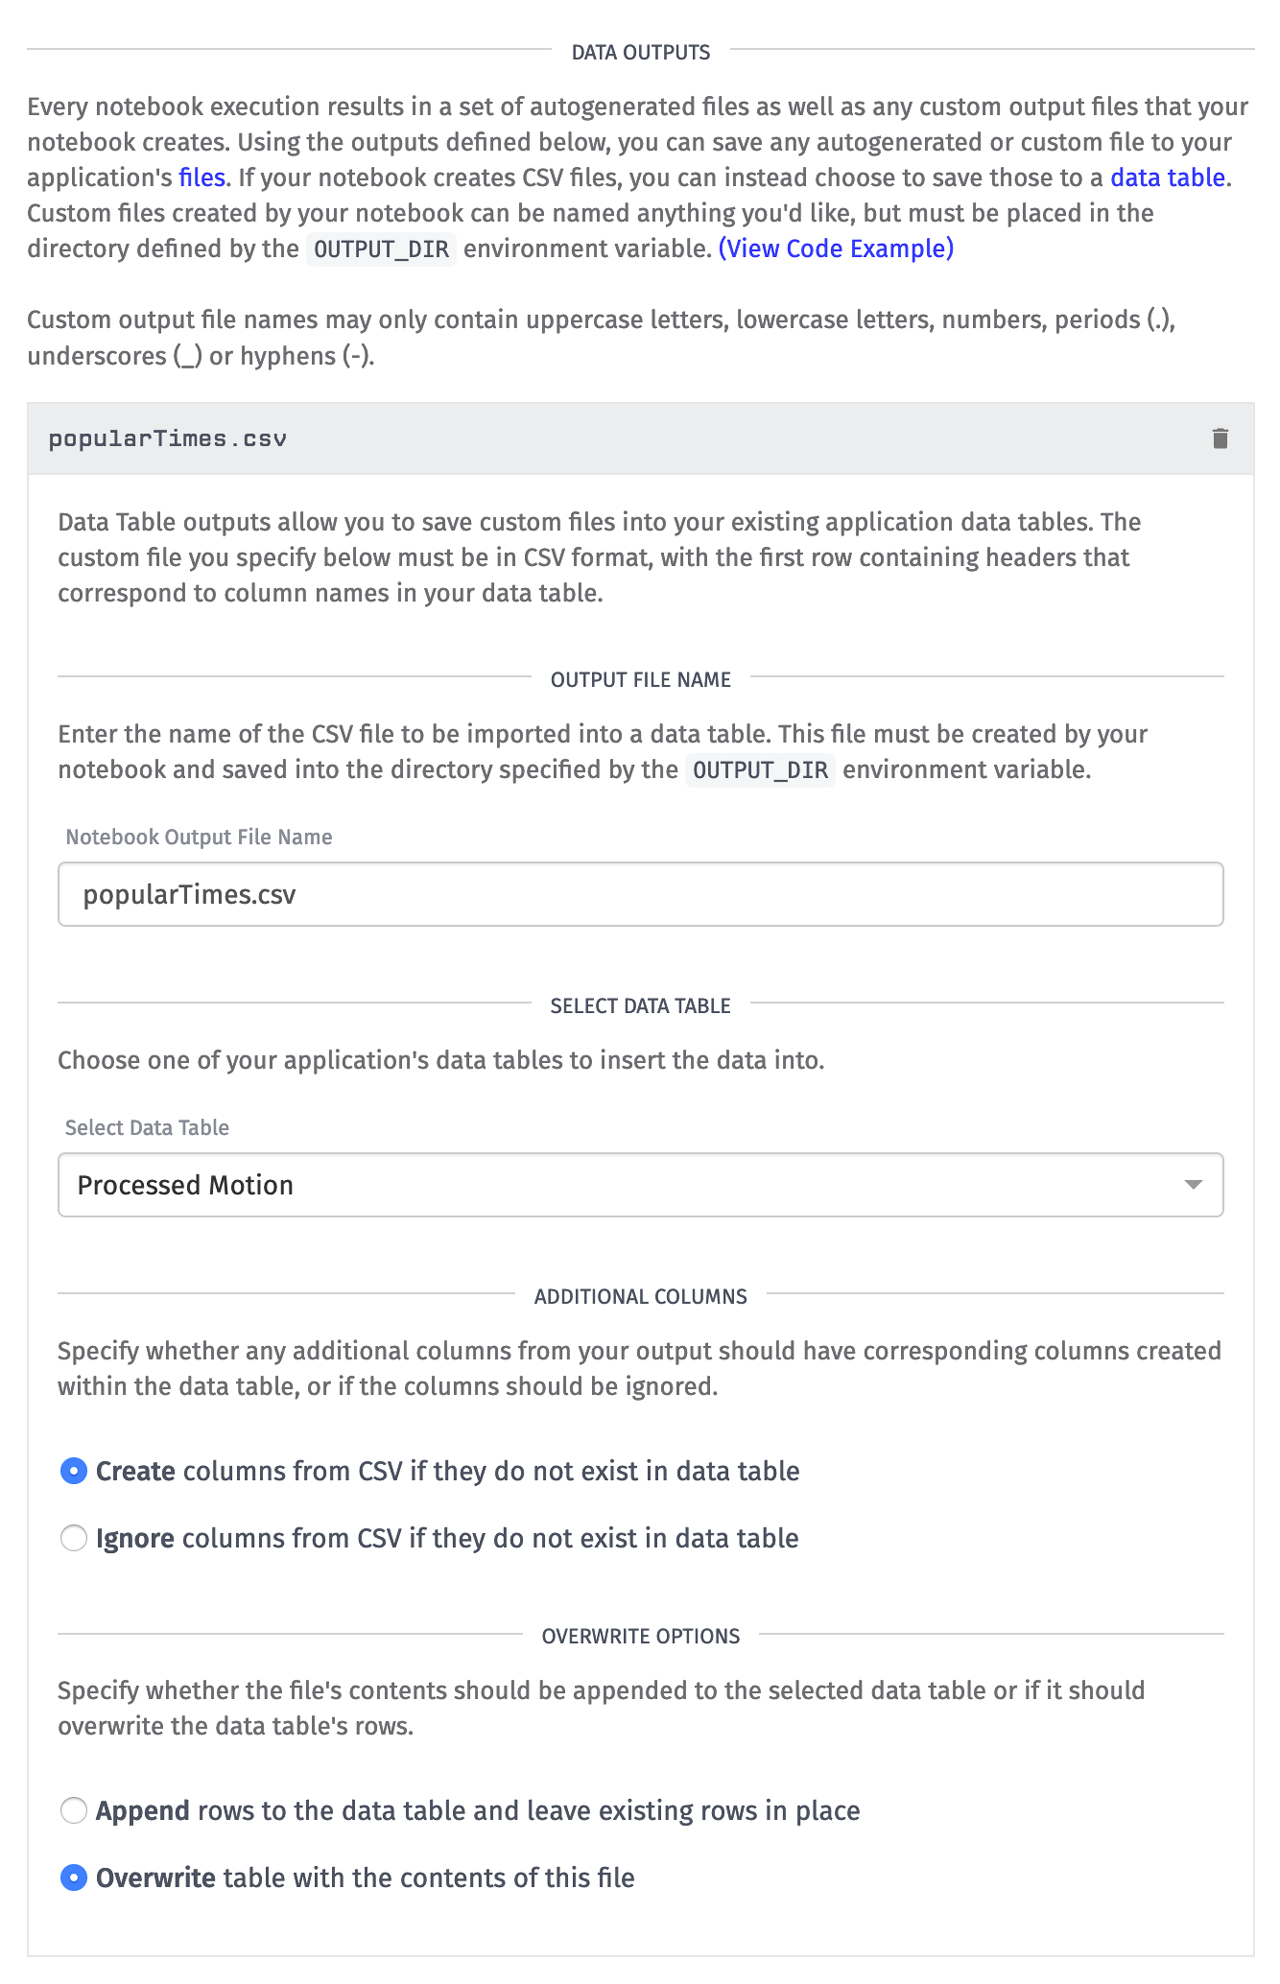
The Notebook Output File Name should be identical to the file name that your notebook created. In my example, it was "popularTimes.csv". I chose to have Losant automatically add columns that are present in the CSV but not in my selected table. This will allow any additional columns generated by my notebook to be automatically added in future executions. I also chose to overwrite existing data. I want this table to always be the most up-to-date information on the most popular times for this conference room.
Step 5: Execute Notebook
Now that you have inputs, a Jupyter Notebook file, and outputs, you can execute this Losant Notebook. Executing a notebook can be done in two ways. You can manually execute the notebook using the Execute button on the top-right of the screen, or you can execute one in a workflow using the Notebook: Execute Node. You should always first execute it manually to ensure there are no errors.
Every execution of a notebook is done in a single-use and dedicated VM to ensure the highest level of security and isolation. Spinning up this VM and performing the data export for your input data can take a couple of minutes. When the execution is complete, the execution log is a helpful place to check the results and debug any errors.
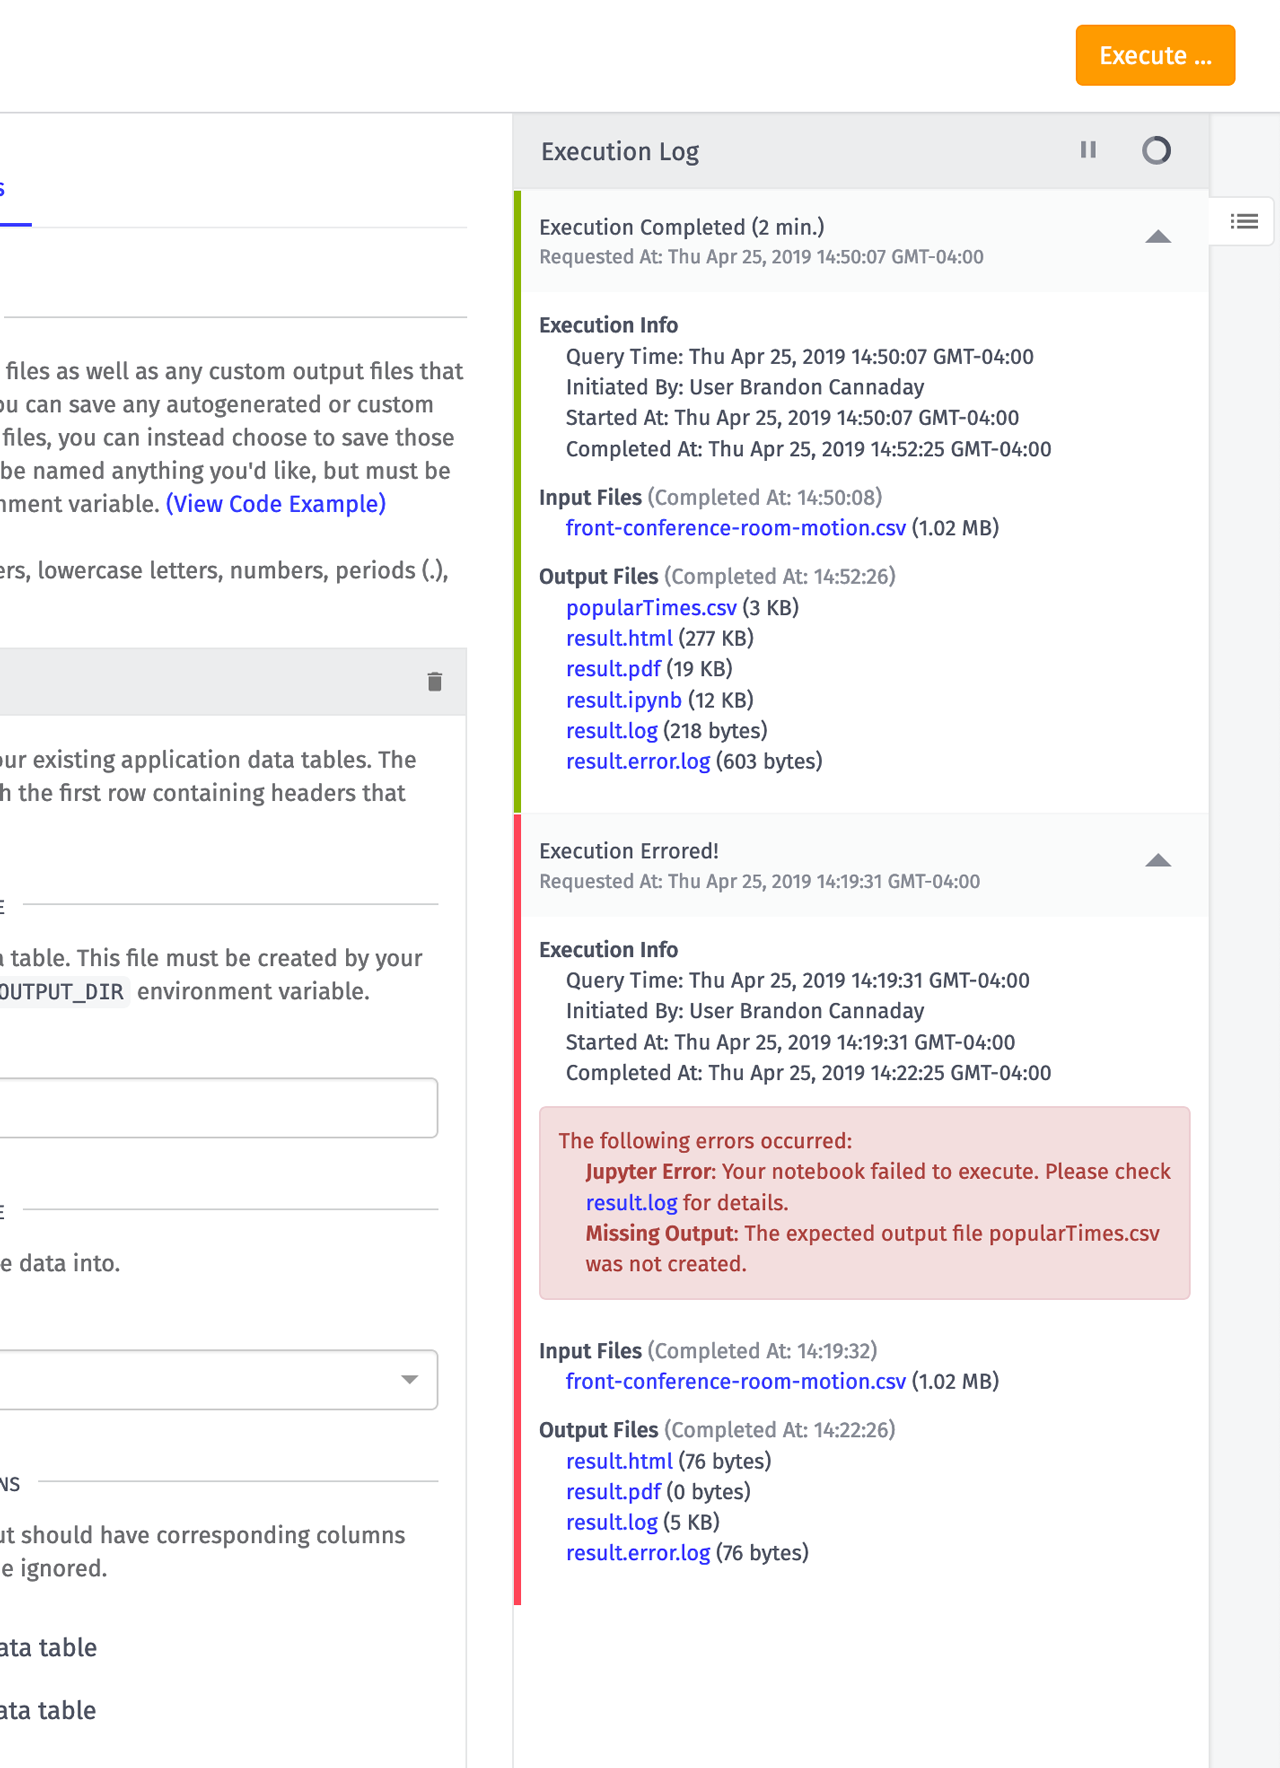
We automatically store the executed notebook in many different formats (html, pdf, and ipynb) and make those available for easy download in the execution log. If your notebook did fail to execute, the result.log file will contain a useful stack trace.
Now that I've confirmed my notebook executes and it creates the outputs I expect, the last thing I want to do is run this every Monday morning at 9:00 a.m. and email myself a report. Thanks to the Notebook Trigger and Notebook: Execute Nodes, building this workflow is easy.
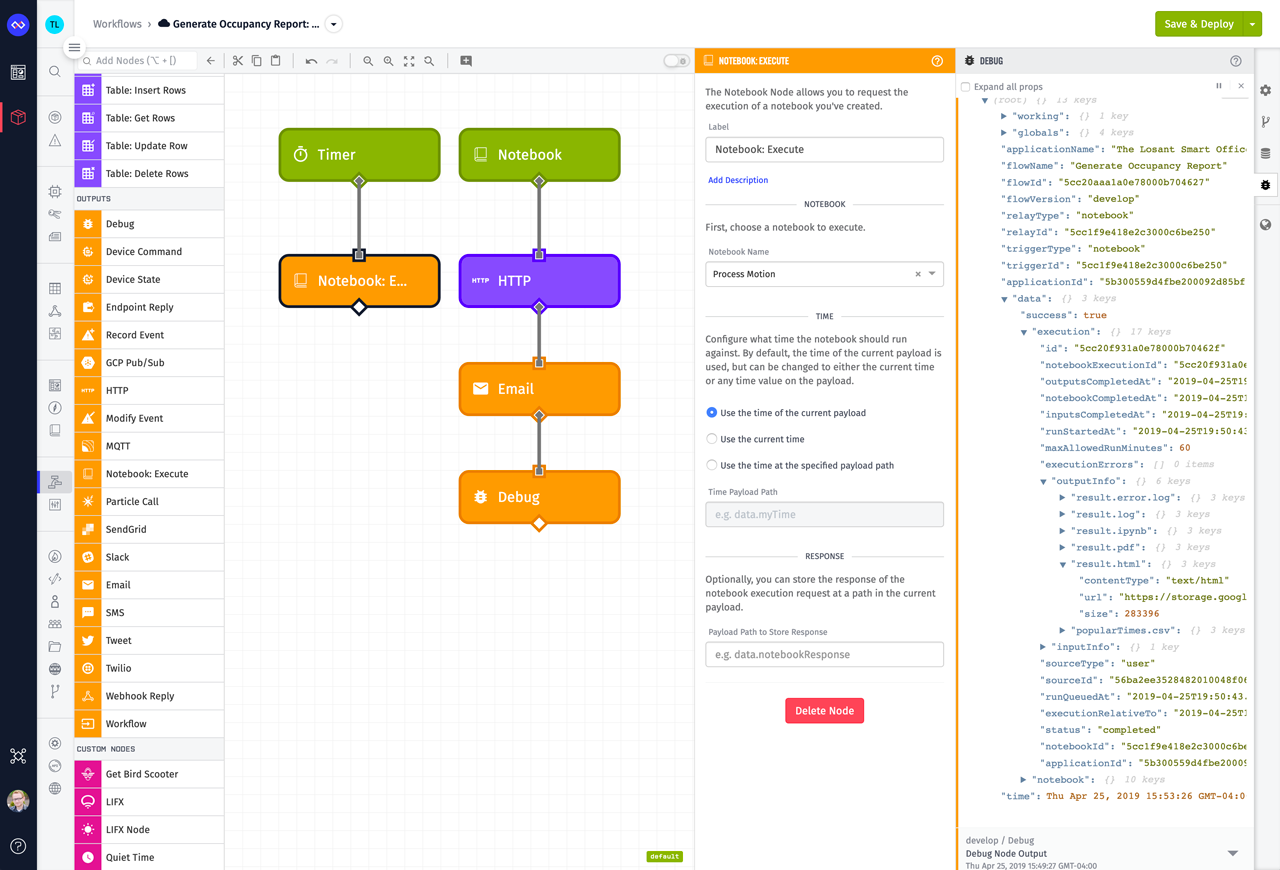
The Timer Trigger on the left executes the notebook every day at 9:00 a.m. The Notebook Trigger on the left will fire whenever that notebook execution completes. The HTTP Node downloads the contents of result.html, which is an autogenerated file we provide for you that contains the executed notebook. The Email Node then emails me that HTML. This is essentially a complete data pipeline and business process implemented in six workflow nodes.
Looking Towards the Future
The integration of Jupyter Notebooks offers a ton of capability beyond the batch processing of historical data. With this foundation in place, we can start exploring much more complicated analytics functionality like machine learning. In fact, our execution environment does have TensorFlow available and we've used notebooks to train ML models from IoT data internally. You can then take the trained model, save it to Files, and then upload it to Google ML where a workflow can execute it using the GCP: ML Node. This pipeline takes some manual steps, but it's something we plan on streamlining with additional functionality.
Notebooks can solve a huge variety of problems, and we'd love to see what you implement. If you make something cool, please show us on the Losant Forums. If you come across additional libraries or functionality you'd like to see, please let us know that as well.
Other Updates
- Added AWS S3: Get Node and AWS S3: Put Node to work with data in your AWS S3 buckets.
- Added the ability to generate a dashboard report on-demand.
What's Next?
With every new release, we really listen to your feedback. By combining your suggestions with our roadmap, we can continue to make the platform easy for you. Let us know what you think in the Losant Forums.