


Nugeen Aftab: Hi, thank you for joining the Deeper Dive webinar. It's now 1:02 Eastern so we're going to go ahead and get started. My name is Nugeen Aftab and I am the Senior Partnerships Growth Manager at Losant. Today, one of our partners, Elipsa AI, is here with us. Their CEO, Jeff Kimmel, along with our very own CPO, Brandon Cannaday, will be going through the application template they built using Losant's platform. I will also be here to answer questions at the end. Before we get started, I want to address a couple of housekeeping items. The webinar is being recorded and the replay will be made available to you in a few ways. After this webinar, we'll send you an email with a link to the replay, and the webinar will also be made available on Losant's YouTube page, as well as on our Deeper Dive webpage. Throughout the webinar you may have questions that you'd like to ask. I would like to point out a couple of key features in the Zoom conference. You can use the Q&A feature or the chat function to post questions, and I’ll be monitoring those throughout the call. At the end of the call, I'll moderate a Q&A session with the posted questions. Great. So, let's do a quick review of Losant and our enterprise IoT platform. Losant is an application enablement platform. What that means is that Losant provides enterprises with the building blocks to create their own IoT applications. Our platform consists of five key components to help customers achieve that: end user experiences, a visual workflow engine, data visualization, devices and data sources, and edge compute. Our customers and partners utilize these tools to create the robust IoT applications they put in front of their end users. Losant is a leader in the industrial, telecommunications and smart environment spaces, and we've offered this platform for all sorts of customers ranging from startups to companies in the Fortune 100. So, if you're interested in learning more, please reach out and we would be happy to set up some time for a much more in-depth conversation. Now let's get into today's Deeper Dive. While Losant provides the software foundation for IoT, there are many other components that have to come together to create this IoT application. We've surrounded ourselves with a great ecosystem of partners, this includes strategic partners with whom we share sales and go-to-market strategies, solutions partners who work with clients to develop end-to-end IoT applications, and lastly technology partners that can provide hardware, connectivity and other services to complete an IoT solution. Today, that is where Elipsa comes in. In March 2020 we released significant functionality to our platform, application templates. These are prebuilt templates that help a customer get their application to market more quickly. And in previous Deeper Dives we have showcased asset tracking, equipment monitoring, overall equipment effectiveness and multiple other partner templates as well. If you've kept up with Losant's growth, you'll know that our template library, including the full-fledged application templates are a pivotal new part of our IoT platform. Our vision is to make the process of creating end applications as easy as possible, which is why support from our partners is crucial. As we continue to build out application templates, we've also asked our partner ecosystem to contribute. Partner application templates are meant to simplify the integration process between Losant and our partners. This means having vendor-specific device recipes, workflows, and dashboards that make getting up and running much easier than ever before. Leveraging the integration work Losant and our partners have already done helps you get your project started and finished even quicker. Today we'll be discussing the application template that Elipsa has built. This application template is now available for you to import into your application. Just click add to create a new application and you'll see the application available. Now I am going to turn it over to Jeff Kimmel to walk through the Elipsa AI engine and how it fits into the world of artificial intelligence.
Jeff Kimmel: Thanks, Nugeen. Just going to share my screen here. Once you guys can see it. Hello, everyone. My name is Jeff Kimmel. I am the cofounder and CEO at Elipsa. Elipsa is a no-code analytics platform designed to empower IoT users to apply machine learning without the need for a data scientist. And so, with that we're going to get into kind of a demonstration of our system. But first I want to start with really what do we mean by AI. Many are often still confused by what AI is and how it applies to them because they're led to believe still that it's a lot of robots and self-driving cars. In actuality, AI is a collection of subdisciplines and all of these are a subset of AI. We personally do work within computer vision and optimization, but our primary focus for our platform and for this webinar in particular is within machine learning and predictive analytics. Machine learning is the branch of AI that's based on the idea that systems can learn from data to identify patterns and make decisions. And with that learning it really starts with a business problem and what you want to predict. People often still get hung up with that word "prediction" so we like to kind of look at it more as what decision do you want to make and automate within your business. And then once you know what you want to tackle, the idea is to look to see what data do you have to support that. Once you have that, the first two steps really are all about the data, and the remainder here of steps three through six are incorporating the science. Our platform automates step three through six to really give you the ability to automate the complexities of the science and allow the users to interject their own domain expertise into the process. Once you know the problem and your data, the path really is dependent on your data. And what we mean by that is our system's flexible enough to learn many different types of patterns; to be successful in implementing AI you need to focus on the data and first ask yourself whether you have examples of what you're looking to predict. If you do, you could teach the system to look for patterns in a variety of different predictions and use cases, such as events and values. And within predicting an event you can look at things like will a tank go below a certain level in X number of minutes, or will a system fail in the next number of hours, or what's the output of my manufacturing process, will it result in a defect. And in terms of values, you can look at what will the future level of CO2 be in a room, how many hours until failure, what's my projected battery life. So, if you do not have the historical examples, though, all is not lost. Many believe that they lack the data to get started with machine learning, but as we'll show today, you can get started with outlier detection without having those examples. The key is having enough data to teach the system what normal looks like so that it can monitor for future abnormal activities. On that, the positive aspect of machine data is that, as you know, you generate a lot of it and so you can build enough data within even a single month, for example, to get started with outlier detection. And so, looking specifically at predictive maintenance, there are multiple ways that you can address the issue depending, again, on what you have for historical examples of failures. If you do have examples of failures, you can look to see if it'll fail in the next number of hours, or even look to see, like I said, how many hours until it fails. We do know, though, that a lot of people, although they've been tracking their sensors, they don't maybe necessarily track those failures enough to be able to teach the system in that way, and that's where outlier detection really comes in. And so, in our example here, what we're going to walk through is going through a use case of looking at a file where we do not have the examples of failures and teach the system to find what's normal, and then be able to make predictions on streaming data to find abnormalities that are indicative of a future failure. And so, with that I'm going to start by looking at, this is the file that we are going to be running through the system. The file consists of a machine setting and a series of sensor datapoints for a turbo fan engine. You'll notice that it's the sensor and machine information, but no file indicating whether there's a failure or not. And so, in the Elipsa system here, first we're going to go through and create a model and show you how you do that, and then we'll show you kind of how to tie that information back into Losant for making future predictions. So, creating a model, again, there's a few different paths that you can go down based on your data. If you have the failure information, you can look at an event or a value. In our case we know we're going to be looking at building an outlier detection model. From here, if I drop in the file here which I dragged into the screen, you'll see the preview down here matches what we just looked at in Excel. And the only information that you need to provide as the user is what we call the outlier sensitivity. The sensitivity determines the threshold of what the system is going to consider an outlier, and so higher sensitivities would result in the system finding more outliers. The good part, though, is this is not a guessing game. For one, the value can be dependent on your tolerance of false positives. If you have a low tolerance for false positives in your use case then you can set the sensitivity to be lower. But more importantly, the level is really dependent on the data that you're using to train the model. So, if the sensitivity is effectively...when you set it you're telling the system how much of your training data is abnormal. So you know that if you're using data from a period of time with no known issues, you're going to want to set a lower sensitivity so that you're teaching it to say that most of the data that I'm giving you is normal, and learn that this dataset is normal so that if you see something in the future of streaming data of your machine that does not fit within the data that it's seen before, it'll trigger an alert notifying of an outlier. Once you set that, you choose your drivers. In this case here you'll notice that all we're doing is pulling in all the fieldnames from the Excel file. And in our case, I’m going to select all of them. You could have instances, though, where perhaps you have a larger dataset and you don't want to select each of them kind of to teach the system, so you do have the ability to kind of pick and choose which columns you use. And then from there, once you choose your drivers, you upload the file and now in the background the system is going through, looking through the file to build out an outlier detection model. And once the model is complete, it'll come back with some information, as it did right here. Now, for our purposes for the demo, the file that we used is quite small. Obviously, as you get larger data files and datasets the time to build the model is going to be longer. It could be, say, up to 30 minutes, but it runs in the background. But the key thing to point out is, when you train the model it could take a significant amount of time, but as you make predictions on that model with your streaming data the predictions are really in fractions of a second. And so, with the data that's returned here with the model we just built, we're showing that basically, in this system, about 0.3% of our data would be considered an outlier. And then of that 0.3%, 1.07% are extreme outliers. So, basically that's saying, is there anything that is extremely abnormal within our dataset, and it doesn't look to be the case. And then down here we're showing that in our case here for outlier detection we do give transparency into the actual algorithm, the AI algorithm that we're using to create this. So, with the model built, if I go to the My Models page here you'll see a list of models. This is where you will see every model that you have built in the system, and every user has these first two by default. These are demo models that we have built and made available for testing. They both are predictive maintenance examples, so the first one here is predicting the amount of time till failure. In this case here, as I pointed out, we had a dataset where we knew when the failure was, so we were able to predict how long before a failure. This particular model here is actually the one that we're tying back into the Losant template, which we'll get into, but it is outlier detection on the turbo fan. And then this is an example of predicting whether an event will occur where the event is a poor-quality output to a manufacturing process of materials. And you'll notice that the metrics are different between the three, and that's really because what we're predicting in a value, an outlier, an event are slightly different, so the way that we present the information back to you is different as well. But the idea is that you could build models in the system and tell instantly whether it meets your requirements or not in terms of accuracy, efficacy, etc. And you'll notice here that we have the one we built as a temp model and it's unnamed. If you go to the model and you save the model, that model now becomes saved in the system for future use and it has an API endpoint exposed for it. And you'll notice every saved model has an API endpoint where each endpoint is a unique endpoint for that particular model. And so, on this example, which is the outlier detection of the turbo fan, as long as you hit this API URL with this JSON dataset here we will return back a prediction of whether it's an outlier and the confidence of that prediction. And you'll notice from the dataset, if you think back to what I showed you in the Excel file and in the system, these are really just the current values of the columns that you use to train the file, to train your model. Effectively, if you're in Losant and you export your devices to a CSV file and you build the model in our system, the inputs that we'll require will be the same device names that you used when you were exporting it and building the model. And so, with that, now, this is the information here that you need to plug back into Losant, and so I think that's a good segue for me to hand it off to Brandon to explain kind of how we take it from there.
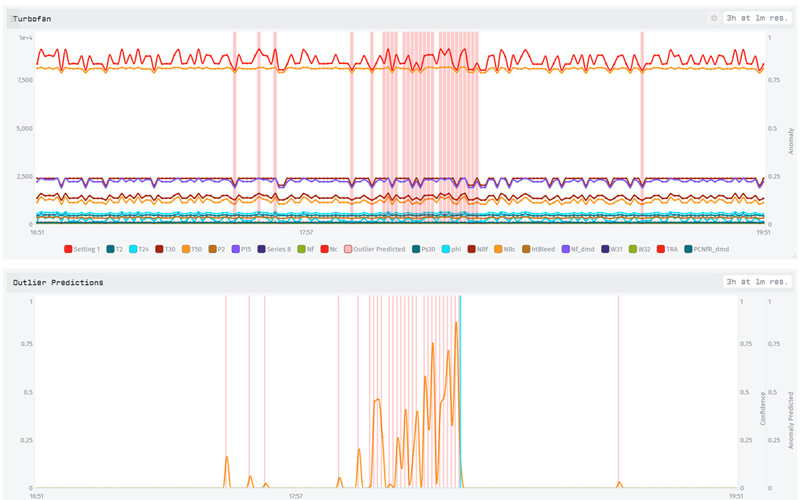
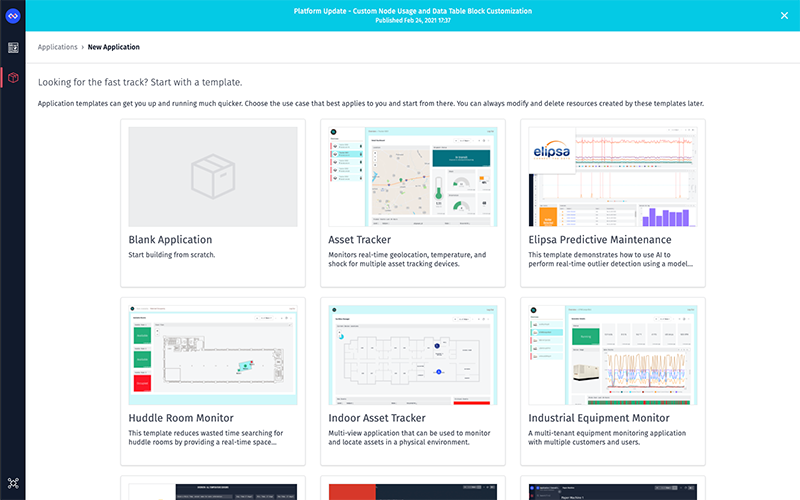
Brandon Cannaday: Yeah, thanks, Jeff. Hey, everyone. I'm Brandon Cannaday, Chief Product Officer here at Losant. While I'm bringing up my screen, what I wanted to talk about a little bit was why I'm so interested in Elipsa and Losant kind of combined. There have been a lot of interest in AIML, especially among our IoT users, and up until now it was pretty sophisticated. The barrier to get even some of the simplest AI implementations was pretty high. When we met Elipsa a while ago, it was really interesting just how well their platform worked with our platform, especially how we store data, how they train models, how they invoke models, get the results. It just worked really well, so it's exciting to be able to do this Deeper Dive webinar. So, anyone that is currently a Losant user and looking for something pretty approachable, this is a great option. What I want to start with here is talking a little bit about the kind of analytics pipeline. I'm going to use this diagram to kind of describe how data is making it between Losant and Elipsa, and what I'm going to focus on mainly is kind of then how to implement a lot of this inside Losant itself. If you are a Losant user, you're probably pretty comfortable with this direction. You've got your devices and they're reporting data to the Losant platform. In Losant we've got the ability to export device data, raw device data. That's really what Jeff showed, a drag-n-drop into that interface, to train a model from that. That's done periodically. You don't have to retrain your models all that often. You can use our export functionality, get all of that raw device data and kind of retrain periodically the model. What is done a lot then is invoking that model. On every datapoint, as data flows into Losant, in real time it's then piped right to that model, invoked, and then in real time we get a prediction back. In this case, this template is using outlier detection, so we'll know if that datapoint represents an outlier based on all of the data that went into training that model. Before I get too far, I do want to let everyone know, just as Nugeen said, this is available as an application template. So, if you are a current user or a new user, Losant does have the developer sandbox, which is no cost. Great place to experiment and explore and do your own POCs prior to implementation. Whenever you create an application in Losant you'll be presented with that template screen, and from here you can choose the Elipsa template. And what's nice about this template and what I'm going to show here today, it's completely self-contained. It comes with a simulator. It's replaying that turbo fan, that real representative data. It's invoking a model provided by Elipsa. So, you can kind of see how all of this works together without having to spend the energy to train your own model, get your own data, things like that. The first thing I want to show is how do you get data from Losant into Elipsa. As Jeff showed, he just kind of took that CSV and dragged and dropped it into the interface to train that model. The first question is probably, well, where do I get that CSV? And on the device list in Losant, when you click devices, there is this small menu button up here with the three dots and that's a lot of bulk operations you can do on your list of devices. In this case, one of them is request data export. If you select that, this will generate a CSV of all of the raw data for the devices present in that list. The models that you train don't need to be what might you think of, like one model per device. If you've got a family of identical devices, this export can export data for an entire group of identical devices. In that case, it's powered by the advanced query. IN this case, my turbo fan device, this application template comes with one, but you could have lots of identical devices. I also want to point out this little button, little pro tip. This allows you to add columns to your device table, and I'm going to add the type column, this is a tag that I've added to devices. So, all of my devices are tagged turbo fan. I could have other types of devices in this application tagged other values. That allows me to go to the advanced query and select all devices with the type equal to turbo fan. So, if I had a dozen, a hundred, a thousand devices all tagged the same type, identical, now I could go request a data export and I would get one CSV containing all the data for all of those devices, which could make a really nice dataset to train an outlier detection model. And once you click that button what will happen is you will get a CSV. And CSV looks like this. This looks very similar to the file that Jeff just showed. You've got the ID of the device, you've got some timestamps, and then you've got all those attributes. And this is basically exactly what Jeff showed. You can drag and drop this right into their interface and begin training that model. So, that's kind of step one. That's how you're going to get data out of Losant. That's going to be, if I switch back to this diagram, that's going to be this step right here: How do I get that data export and train that original model. Moving on from there, now let's kind of dig into this template a little bit and show how this model's invoked, how we're simulating this data and then ultimately presenting and taking action on predictions. If I switch to the dashboard that's part of this template, it looks like this. The top graph is essentially the raw telemetry data coming from this device. I am overlaying outliers. These little red bars are whenever an outlier is detected. The second graph down here is the data straight from Elipsa. The orange graph is that confidence level, and the red is when an outlier's detected. This is showing failure. The underlying dataset that we are playing back as our simulation data does have failure data, but really important to note, the failure data is not used to train the outlier detection. If you remember from what Jeff had said, if you do have failure data you can use it to start predicting failures, but we had chose to not use any failure data for this template because we kind of felt a lot of our customers are just kind of getting started with collecting that industrial data, may not have enough failure data to train a failure prediction model. But you don't need that failure data at all to do outlier. You can just take your raw device data and train a model with it. But in this case, it is in the underlying dataset, so it's fun to present. And really it shows even how valuable outlier detection can be because you can see these outliers are building up and then ultimately results in a failure. So, you can still detect failures when your outliers start cropping up. Even if you're not predicting actual failures, you can get some early signs that something is definitely wrong. At the bottom of this dashboard we are creating events. Whenever an outlier is detected, we'll create an event. This is for kind of the action side of predictive maintenance. Presenting it on a dashboard is one thing, but the real value is taking some kind of action when its outlier is detected. In this case, we create an event. In here a technician can see these events, they'll get all of the telemetry data that was used as part of that prediction. They can come down here and acknowledge it, maybe they can resolve it and say, "Oh yeah, we replaced that part," whatever it might be. Another interesting action you could take is command and control. So, if an outlier is detected, you could send a command back to that device, depending on what kind of equipment you're using, and potentially tell it to shut down. An outlier could be an indicator of a failure that could cause damage to the equipment. So, you can think about sending commands back to the device when certain things are predicted. And the last graph here is pretty simple, just kind of adding up the number of outliers we're detecting per day. Now what I'm going to do is kind of step through these top three charts and really talk about how this data's coming together. Normally we don't really talk about the simulator for our templates. Most of them have random data simulators, but the simulator in this template is actually playing back data from a real turbo fan, and turbo fans are kind of these things, if you've never seen one. And what's nice is NASA has this prognostic data repository where you can go get some pretty representative datasets, real-world datasets, and this is the one we're using. A portion of this was used to train a model, and then we're taking a different portion and playing that back as simulated data. What I want to do is show the workflow that's actually simulating that because this is a really interesting use case for a lot of applications, where you can take a portion of real device data and play it back through Losant. So, just like I exported that device data, you can actually use that in a very similar workflow to this and play back old device data as part of your development process. If you want to test some of your ongoing development and test how your application behaves under situations that you may already know, this is a really interesting way to do that. You can kind of just play back that old data, see how your application behaves, and then address it or fix it if it doesn’t behave exactly like you'd like. But in this case there is a CSV file inside files, so down here in the menu, files. Losant has file storage. And that contains about 3700 rows of data that we're going to be simulating. Every minute we're going to take the next row off of that file and record it as device state, and that basically mimics our incoming sensor data. If you've ever asked your question, well, if I have a file in files, how do I get that into Losant? Well, really you just download it using an HTTP node. So, the files when you select it will give you a URL to that file. You can just use that with an HTTP node and download it directly to your payload. It's really important to check errors, especially if you're doing external operations like database operations, or in this case an HTTP request. There’re a million things out of our control, out of your control that can cause one of these things to fail, so you always want to check the success of any kind of external operation. In this case we're checking the status code of the HTTP reply, making sure it's 200. Then we know we got the file, we got the contents, we can continue on. Losant has a CSV decode node already, just in the palette, you can decode any CSV data into a structure on your payload. If I expand the payload you can kind of see what that will turn into. Kind of looks like this over here. We got an array. Takes a CSV, turns it into an array on the payload, one object for every row. And here's the object and inside it is all of those columns. Then we're going to increment a value because what we want to do is slowly increment through that CSV and record it back as simulated data. Another pro tip: If you are ever in need of a counter in a workflow, it's really important to use the storage increment and decrement value. If you've got a lot of data being reported quickly, Losant will run your workflows in parallel and that is very easy to get into what's called a race condition. If you've got two workflows trying to increment the same value at the same time, things can get a little bit confused, but Losant handles that behind the scenes if you use the increment and decrement operations in the storage. That's what's called an atomic operation, it will take care of that for you. The mod operator. If you've ever done any kind of programming, mod operator is basically like a remainder. It allows us to continually increment a value but never resulting in a value larger than the count. So, we're continually incrementing this index value, modeling it by the total length of the data, and what that's going to result in is a constantly repeating number between zero and the length of that array. Kind of a trick to get us to restart back at zero once the counter exceeds the length of our data. Mutate node pulls the operation, or the item we want out of the array. And then the device state node is reporting that. Another trick here. A lot of people start with the individual fields, which will just dump text boxes for every individual attribute, but if you do have a object on your payload that matches your attributes from your device, you can actually report that object as device state. And that can sometimes be a big-time saver, gives you a lot more power in how kind of that state object is created and reported. In this case, I’m just going to take this entire object, report is as device state without having to define all those rows. I know normally we don't spend a lot of time in the simulator, but I thought this one was a little bit unique. It provides an implementation option even outside of this template, if you're doing your own work, on how to kind of simulate data from existing datasets. So, we step back to that workflow, that's what's generating data on the top. That's just all this telemetry data, roughly 20 attributes. Now let's get into actually invoking the model. We've got incoming data, now we need to, every time one of those state payloads is reported, we need to invoke Elipsa in order to get a prediction of whether or not that data point represents an outlier. Now I'm going to go to the predict workflow. This template has two workflows, one to simulate and one to predict. This is being triggered on all device state except the anomaly score and the prediction, and that's because this workflow is actually reporting these attributes. And this is another pro tip: Something that a lot of new users get into quickly is creating an infinite loop. Because this workflow both triggers on state and reports state, it's kind of easy to get into a problem like this where workflow is triggered, this workflow records state, and then that state immediately triggers the workflow again. Now, Losant will detect this and your workflow will result in an error, but you kind of want to avoid that all together. And how we do that is by saying, well, we don't want to trigger this workflow if what was reported came from this workflow. This helps us prevent this infinite loop. What will come through is all of the device data every time that telemetry data is reported. We're going to send that directly to Elipsa. Just as Jeff showed, the API you get when you look at one of your models. What's really nice about this and why this works so well is the same attributes that you exported and trained the model, those are the same attributes that the API expects when you invoke that model. Just makes it very easy to kind of pass around this data without having to use some fieldnames here, some fieldnames over here. What we're able to do in that case is just take the actual data object and encode the entire thing and just pass it to Elipsa, because it's the exact fields that it expects. Makes it very easy when you're operationalizing applications like this. And it's okay to add fields it doesn't expect, it's not trained on. It'll just ignore those. Just like before, we need to check the output code. If Elipsa, for whatever reason the internet was down between our platform and their platform, we need to make sure we got a result from them. And then we're going to report the result on to that device. If I expand this workflow, you can see what they're giving us back is the anomaly score and the prediction. In this case an outlier was not predicted on this data point, so it's zero. I do want to highlight this. This is kind of another advanced pro tip. You can put pretty complex expressions, or not expression, templates right in the value of your attributes. And what I wanted to put here, what I'll show is I'll actually take this to our inline template tester here. This little button right up here allows you to kind of test these templates out. If I click that, type that template in, what I'm saying here is if I got a prediction, if it's basically a one, it's either going to be a one or a zero, I want to report the score provided by Elipsa. And what we found was Elipsa reported some negative numbers for the confidence here. And really, if I didn't get a prediction, I just want that to be zero. If prediction was zero, I'm reporting that zero, otherwise I am going to report exactly what Elipsa provided. And the confidence is roughly a number between zero and one. One indicating a very high confidence. That's how we get the data, prediction values and the confidence values, onto the device. It's really boiled down to invoking the Elipsa API. And when you use Elipsa for your own accounts, training your own models, what will change is your API endpoint will change, and in this case, I have it stored in globals. Globals are down here. When you add an application from this template, you'll see the model that Elipsa made available to all of us using this template. You'll see that URL in globals, but you would change this to your own and change the data structure here to match the model that you trained. Lastly, what this workflow is doing is creating an event. What we want to do is, if we get a prediction and the confidence is fairly high — we're going to say is it 0.5? — we want to go ahead and create an event in the Losant system. This is a really good example of the latch node. The latch node allows us to do an operation once until it's reset. What we noticed was, once an outliers detected it's usually detected for a lot of subsequent data points, kind of leading up to a failure, and then they'll reset back to no outliers. And we didn't want an event for every individual data point if it just kept repeating outlier. That's what a latch allows us to do, essentially it will allow the event to be created one time once prediction gets set to one and our confidence is above 0.5, but it won't allow the right path of the latch to continue, again, until prediction resets back to zero. If you're ever asking yourself, I'm getting a lot of duplicate alerts, duplicate events, definitely look for the latch node. If we go back to that dashboard, now we can kind of see we've got the raw data coming in, we've got the overlays, and now in the second graph we’re starting to get some predictions with their confidence on the second graph. What I'll touch on really briefly here is people fairly new to Losant might be asking, how do I get this overlay, this bar on the graph when a outlier's predicted? How do I overlay that on my data? I'm going to just jump very quickly into this dashboard block and kind of show how that's done. What I'm graphing here is historical three hours' data where the resolution is one minute. Our simulator is running every one minute so we are basically showing all data. And I've got a segment for every attribute on this [Distortion 00:37:17] with a color. Most of my attributes are lines. If I go to the outlier predicted segment it is instead a bar chart, and the bar chart is what gives me these zero to one vertical, like, sticks. Most of the time prediction is set to zero, so even though there is a bar down there you can't see it. And then as soon as a prediction value is set to one, it'll draw a line all the way up and down the axis. Another tip is these can be semitransparent. A lot of people may not know this. You can actually make the color of your segments transparent. I wanted the prediction overlay to kind of be behind the data, I didn't want it obscuring the data, so I set its alpha channel to 24, roughly 10%, so that it doesn't hide anything behind it. That's a good way to kind of combine two types of displays on one chart to display two types of information. With that, that's essentially all it takes. The Losant side of this is pretty simple. All of the heavy lifting was done by the Elipsa AI engine. And really, what you're doing in Losant then is creating that data pipeline around it. What I showed was using a simulator to kind of replicate receiving device data and then in real time piping that device data to your trained Elipsa model, getting that prediction result back into Losant where our template was creating events, but that’s where you'd create your domain-specific action item, what does that prediction mean to you in your business, and then also, how to get that data out in order to periodically train your Elipsa AI models. With that, I'll hand it back to Nugeen where we can get some Q&A. Nugeen.
Nugeen Aftab: Great, thank you. All right. Thank you very much, Brandon and Jeff, for showing off the Elipsa AI application template. The integration with Elipsa AI's engine really extends what you can do with your Losant data, and I'm excited that we are able to provide this as a partner template. We have a couple questions that have come in through the chat that we'll get to right after one last note. If you have any questions that pop into your head, please make sure to put them in the Q&A section of the webinar software. If you have any questions about this webinar or as you’re getting started on your Losant journey, we have tons of resources to help. Losant University is a great place to get started, and our thorough documentation and active forums are fantastic tools to help. For reference on applications we have built, check out replays of our past Deeper Dives, and if you are ready to start building, try out one of our hands-on tutorials. Now let's get into some questions. The first question I have is for Jeff. Do I need a data scientist to use Elipsa or to use Losant with Elipsa?
Jeff Kimmel: Sure. The short answer there is no. Our entire goal and mission, we call it approachable AI, and the goal is to really be able to allow non-data-scientists to apply data science techniques. I gave the example; I showed the example of creating an outlier detection model. That was the full process of creating the model, so there are no shortcuts, say, that we went through. It's a few simple clicks to be able to create a model. If you're creating an event or predicting a value, really the only difference is you're just also telling the system through a dropdown which column has the data that you're looking to predict. As long as you understand your data, you really don't have to fully understand the science to be able to apply the data science techniques.
Nugeen Aftab: Great. Okay. The next question we have is also for Jeff. Do I have to use a CSV or Excel file to get data into Elipsa, or can I bring in data from a third-party service?
Jeff Kimmel: So, currently, for building the initial models it is CSV and Excel. With that said, it is certainly in our roadmap to build out third-party integration. And particularly if the third parties have APIs, we can certainly work with customers to be able to integrate those in and pull data directly through APIs and kind of go around the CSV and Excel. Most of the people that we've worked with have had CSV and Excel pretty readily available, but particularly as you get into larger datasets the APIs make sense, so that's certainly something we can work with people on.
Nugeen Aftab: Fantastic. Another question for Jeff. You have an API to send real-time data to Elipsa to run through the model. Is it also possible to use an API endpoint to send the initial raw data to build the model in Elipsa?
Jeff Kimmel: So, the API endpoint is kind of similar to the last question on building the initial, but I will kind of put that into a second form of question around retraining, because obviously as you're making new, real-time calls to our predictions via API, we do have the ability to effectively treat that as what we'll call incremental data and periodically take that incremental data and the original data that you provided to be able to more seamlessly do retraining through an API like that.
Nugeen Aftab: Fantastic. Another question for you. Are there any best practices you recommend for gathering and reporting data to the AI engine? And there might be something here for Brandon to answer, too, if he has anything to add.
Jeff Kimmel: That's a really good question, and I think that the answer sort of depends on the use case. I'll talk about it broadly and then specifically to predictive maintenance. Broadly, one of the things I would say is, if you are, let's say you're monitoring a room, let's say even for predictive maintenance you're monitoring an HVAC system, say, and you are recording the temperature every second but the humidity every minute. You do have to consider either, say, down-sampling your temperature to be per minute or up-sampling, as they call it, your humidity to be every second. So, frequency of your data recordings can be important when you're combining different sensors and different devices into a AI algorithm. Particularly to predictive maintenance one thing I'll say from a best practice standpoint is, let's say you are recording everything every second, but perhaps you only want to run a prediction every 10 minutes as to whether there is an abnormality in the system. So, you could just take a snapshot of each sensor, the last reading every 10 minutes and that could give you a good indication of outliers or not. One thing that I've seen that works better and we like to kind of lead some of our customers towards is more towards rolling averages. So, if you are making a prediction every 10 minutes, maybe think about sending Elipsa not the last reading but the rolling average of your readings over the past 10 minutes. And really, the reason for that is it helps to fight those one-off outliers of what's noise, as opposed to looking and teaching your system about trends, which are more powerful in indicating potential failures.
Nugeen Aftab: Great. We have a couple of questions around the actual Elipsa platform itself. The first is, does the Elipsa training interpret timestamps automatically?
Jeff Kimmel: It does. Timestamps are very interesting, and dates are very interesting when you're teaching an AI system. If it sees a column that is a date or a timestamp, it will effectively automatically... To back up, we're not just creating AI models, we also do transformation of the data in advance to prepare the data as much as possible for AI algorithms. And so, timestamps it will break it into hours, months, days, years. Days of the week specifically. But why I say we have to be careful of that is it really depends on your use case because, for example, if you want to do predictive maintenance for monitoring a system, I would almost ignore timestamps and not include it. For example, if it's in your dataset that's fine, but if column…I showed kind of how to pick the columns that you're going to use, you can unselect certain columns, I would unselect date and time in a lot of instances — not all, but many — because really if you have a timestamp of nine o'clock, you're really teaching the system that that is the normal behavior of the system at nine o'clock. You want to be careful of including timestamps, but if you do think that it is important to with, say, cyclical data, then yes we do interpret it automatically.
Nugeen Aftab: Okay. Is Elipsa able to evaluate outliers in the relationships between data points or just in individual streams themselves? Can calculated values be integrated?
Jeff Kimmel: Let me think about that question, make sure I'm understanding it correctly. In terms of between the data points themselves, really what it's doing is it's taking the stream of a collection of data points and almost combining it into one data point. We do have the ability to say which of the data points is increasing or decreasing the probability of it being an outlier, but I still think that's probably within the actual stream, not between the data points themselves. So, I'm not sure if that addresses the question or not. And then with calculated values, if you're calculating the value in, say, Losant and sending it to us, Elipsa doesn't know whether it's calculated it or not. For us, it's really data in, data out. And so, we don't have the ability to do calculations of our own yet in our system, but if you have the ability to do it in a third-party system like Losant, like let's say you're combining two columns into a new column, as long as you have the ability to export that to train the model and then to send that same value to us for the future predictions, then we certainly can take calculated values of any kind.
Nugeen Aftab: Okay, fantastic. Another question on the platform itself. When data contains setpoints, how does it relate to the measurements affected by those setpoints?
Jeff Kimmel: Trying to think if I... I'm not quite sure what you mean by setpoints in that context.
Nugeen Aftab: I think we can come back to that one. I actually have a question here for Brandon, as well. So, Jeff talked about the averaging of data as a best practice. Is there a way to buffer that data within the Losant platform and send it up?
Brandon Cannaday: That's a good question. I think I might have to ask Jeff, as well, from their capability. So, what we had shown was, I guess there's two questions when you say buffering and averaging. When it comes to averaging that's fairly straightforward. There is a moving average node in our template library that will do a count based, so every N data points it will spit out an average of the last N data points. It's not time based. Little more challenges come with time based, especially if you have an intermittently reporting device and it doesn't report over, like, 10 minutes, what do you do? That gets a little use case specific. But you can check out that moving average one. If you do want to average a few data points together and send averages to Elipsa, that's pretty easy to do with the workflow engine, the moving average node, or implementing your own kind of sophisticated averaging with workflow storage as well. When it comes to buffering, I did notice that the Elipsa API is a array, so the data field is accepting an array. This is, I guess, a question for Jeff. Our template is reporting individual data points. Jeff, can I put an array of multiple data points in there and then will you reply back the prediction and confidence for each individual data point? Is that how that works?
Jeff Kimmel: Yeah, there's two pieces to that. Currently, that's how it works. It's effectively for batch inference. If you have a collection, let's say, to your point, buffering, you're collecting data over time and then you just want to run a series of predictions on that, you can send them all as just multiple data points within the API and we'll return one prediction for each of those. Now, one thing that we're working on in our next release is around templates for use cases. And it's more around data transformation templates. And so, for example, when I talked about the moving averages, let's say you don't have the ability to calculate moving averages or something along those lines in your own external system. We have the ability to create the moving averages when you train the system, and then going forward you either have the ability to send the moving averages already, or let's say you want to do 30-minute moving average, you send us the last 30 minutes in the list and we will roll that up into one prediction. That's in our kind of next release, but as of now that list that you talked about is to be able to do more batch mode inference of making predictions on a collection of data points as opposed to streaming individual ones.
Brandon Cannaday: Got you. That would actually work really well for any Losant users on there that might be investigating batch reporting of data. We're finding using the blob attribute can be a successful way to report blobs of many data points at once, and you get all that available in your workflow, then you could send all of those to Elipsa at one time. Rather than invoking the API a thousand times, you get to invoke it once. That's going to result in much more performance, much less roundtrips through service to service and back. So, could be a good option.
Nugeen Aftab: Great. We have one last question. Can I forecast the next, for example, 10 days and look for outliers? That might be a good one for you to answer, Jeff.
Jeff Kimmel: Yeah, that's a good question because forecasting is a good and common use of AI and it's one that is often written about. In our system, you wouldn't necessarily be forecasting outliers. So, the only way to do forecasting is if you have the data that includes examples of the kind of data that you're looking to predict. And so, with that, if you say I want to predict if the machine's going to fail in a week, you would be able to forecast that out if you have historical machine failure information. Another example on predicting a value is, in the slides I gave the example of, say, being able to predict the level of CO2 in a room 30 minutes out, or be able to predict that amount of liquid in a tank one day out. And so, there, as long as you have historical values of your CO2 or historical values of the level of gas in the tank, that's when you can get into forecasting in our system. But it wouldn’t be able to forecast outliers that far out. Outliers, like we said, is a great way to extract insights and value from data where you have a fair amount of data but you might not have the historical examples of, say, failure. But if you want to get more into the forecasting or more into kind of some more intricate use cases around events and values, you need a little bit more of the historical examples to go off of.
Nugeen Aftab: Great. Well, I appreciate you being here as a part of this webinar today, Jeff. What is the best way for everyone to get started, and how do they reach Elipsa if they are interested?
Jeff Kimmel: Yeah, sure. Well, for starters, within the template our website will be listed within there, but it's elipsa.ai. The best way to get started is to book a demo with us, and then once we book the demo we can set you up with the system and the key, which also works quite well with the model with Losant is, we do have sandbox where, when I showed you that we created a model and it created it with a name of temp, those models are stored in our system for a week so you can create as many models as you want with the idea of really taking your data, building a model, and really making sure that the model produces the results that you want. Because the worst part about some areas of data science is it's really expensive to bring in a consultant or machine learning expert and, at the end of the day, you spend a lot of money and time building a model and find that the data just wasn't good enough to begin with. And so, the real value of our system is kind of instant feedback of what the metrics and the accuracy and results were of the model. And then if you find value in it and you save the model for future use, that's when the kind of payment kicks in for our services. But we can certainly get people up and running with building and testing our system, so definitely feel free to reach out through our website to book a demo.
Nugeen Aftab: Fantastic. Well, thank you so much for being here, Jeff. We are really excited to see how Losant users start to utilize this template. And we're excited to see how we can continue to grow together, as well.
Jeff Kimmel: Likewise. Thank you. Thank you, guys, so much, and thanks everyone for tuning in.
Nugeen Aftab: Fantastic. We have some great upcoming Deeper Dives scheduled or in the works. On April 27th we'll have another partner template. Lanner and Brandon will be showing off a Modbus Edge Compute application template. To register, go to losant.com/deeper-dive. Once again, look forward to this webinar's replay. Thank you so much for tuning in, and we will see you on the next Deeper Dive.