


Aidan Zebertavage: All right, everyone, it is now 1:02 PM, and we're going to go ahead and get started. Thank you very much for joining us for this Deeper Dive webinar. If this is your first time joining us here at Losant for one of our Deeper Dives, welcome, and if you're one of our returning attendees, welcome back. We are very excited to have you all here with us today. My name is Aidan Zebertavage. I'm a member of Losant's education team, and I serve as our technical evangelist. Just briefly before we begin, I wanted to mention a few housekeeping items. For your awareness, this webinar is being recorded, and the replay will be made available to you in a couple different ways. After this webinar, we'll send you an email with the link to our replay, and additionally, the webinar will be made available on Losant's YouTube page, as well as on our Deeper Dive web page. Today, we are very lucky to have Maria Lang, one of Losant's solutions architects, to lead us through a new addition to the Losant application template library. Maria will take us through Losant's OEE application template and speak to not only how enterprises can think about implementing this strategy, but also to highlight key functionality and outputs of the template, and how that can be leveraged for your enterprise. Afterwards, myself, Maria, and Taron Foxworth, Losant's education lead, will be available for a Q&A session here on the Zoom call. And to that note, if you do have questions that you'd like to ask, I'd like to point out a couple of key features in the Zoom conference. You can use the Q&A feature or the chat function to post questions, and I'll be monitoring those throughout the call. At the end of the presentation, I'll moderate a Q&A session with the posted questions. If you do have to leave early, not a problem. The Q&A will also be posted as a PDF alongside the replay link after today's presentation. Now, prior to handing it over to Maria to speak directly about today's OEE application, I'd like to do some level setting around Losant and our enterprise IoT platform, especially for those of you that might be new to Losant. Losant is an application enablement platform. Now, what that means is that Losant provides enterprises with the building blocks to create their own IoT applications. The platform itself consists of five key components to help customers achieve that. They are our Edge Compute, our Devices and Data Sources Management, our Data Visualization Tools, our Visual Workflow Engine, and our End-User Experiences. Think of these as your building blocks to build a full IoT solution. Our customers and partners utilize these tools to create the robust IoT applications that they then put in front of their end-users. Losant is a leader in the industrial, telecommunications, and smart environment spaces, and we've offered this platform to a range of customers, including those in the Fortune 100. So, if you are interested in learning more, please reach out, and we'll be happy to set up some time for a much more in-depth conversation. Now, while Losant provides the software foundation for IoT, there are many other components that have to come together to create an IoT application. So, we've surrounded ourselves with a great ecosystem of partners. This includes our strategic partners with whom we share sales and go-to-market strategies, solutions partners who work with clients to develop end-to-end IoT applications, and lastly, our technology partners that help us provide hardware, connectivity, and other surfaces to complete an IoT solution. Now, on to the focus of today's webinar, Overall Equipment Effectiveness or OEE, as it is sometimes referred to. To understand Losant's approach to OEE, Maria will be taking us through the following. Alongside a live demo of the Losant platform to highlight the functionality of this new template, she's going to be covering what exactly is OEE. She's going to provide a review of Losant's time at value aggregation tool, and why that is such a critical piece to this OEE template. And finally, really highlighting what those major value adds are for manufacturers, and why OEE is so important in manufacturing. Now, you've heard me use this term a couple times, application templates. For those of you unaware, application templates are resources within the Losant platform that provides a set of real-world reference implementations that you can use for architecture guidance, implementation best practices, and starting points for your own applications. And what's great is these are all in a demo ready format, thanks to their ability to simulate device data. Now, I also have a background in manufacturing and industrial environments, similar to Maria, and the value of the OEE templates to me, when I first saw it, was immediately apparent. The ability to leverage the Losant time at value aggregation tool to enable remote monitoring of OEE metrics and provide a visual indication of downtime events across your unit operations, I mean, that's something that I personally wish I had access to during my petrochemical engineering days. This template would have provided me an excellent starting point for developing an OEE monitor for unit operations without the need to build from scratch. And so, that's my little plug, but with that, I would love to hand it over to Maria and get this Deeper Dive underway. At this time, I'll let her share her screen and get started.
Maria Lang: Great. Thanks, Aidan. Let me know when you can see my screen. Are you able to see my screen?
Aidan: We can.
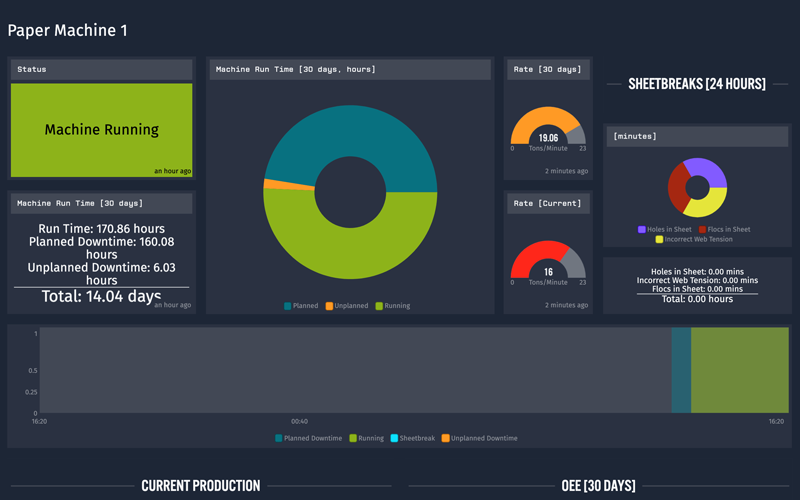
Maria: Okay, great. So, hello, everyone. Like Aidan said, my name is Maria Lang. Before coming to Losant, I spent a little over seven years working in manufacturing. The first half of that time on startup and the running of a paper machine that created toilet paper or paper towels. And then, in the second half of my manufacturing time, I spent designing CNC machines and running an operation manufacturing floor. So, let me start off by explaining what OEE is, to those of you who are new to the concept. So, OEE stands for overall equipment effectiveness, and it identifies the percentage of time the machine or process is actually productive. OEE can indicate areas of concern and help your engineers and technicians focus on the items that will yield the greatest results for your manufacturing process. OEE is a very process-driven tool, and it needs to be tweaked or adjusted based on the type of equipment, the process, your company, the production schedule, etc. The Losant OEE application template is an example of an implementation of OEE. The template can be used to guide your thinking and help you implement your own solutions. Now, because this is process driven, I had to choose a manufacturing process to simulate for the application template. So, I went with my knowledge on paper making, and I simulated a paper machine that creates toilet paper, so that is the manufacturing process that is used in the OEE application template. So, this diagram is showing you the connectivity of the paper machine. So, on the left, you can see the two paper machines. They each run on their own PLCs, so they're receiving commands and they're being controlled through their own unique PLCs. Now, the PLC is then connected to a Losant Edge Compute, where the data we're interested in monitoring can be sent through a secure connection to Losant up in the cloud. Once we get it into Losant, we then perform our OEE calculation using our workflow engine, and then you can display not only OEE, but other metrics that you would like to remotely monitor for your process on the dashboard. So, the OEE application template includes two devices, both of which are paper machines, a paper machine dashboard, and two workflows, one to simulate the status of the paper machine and the production of toilet paper, and the other one calculates OEE for each device. So, what I'm going to cover first are the three metrics of OEE, and I'm going to walk you through what each one is, how it's calculated inside of Losant, and why it's adding value to your process. So, let's dive in. The first metric is availability, and availability indicates the amount of planned production time the process is actually running. Availability is calculated inside of Losant using our time at value aggregation tool. So, what is time at value aggregation? This is a tool that we built to answer the question, how long has a given attribute been equal to a specific value? So, the time at value aggregation will return the amount of time in milliseconds that that specific attribute was equal to a specific value. So, in this simple image or graph that you're seeing right now, you can see that the time at value that it's equal to 2 is 4 hours. The time at value equal to 3 is 5 hours, and the time at value equal to 4 comes out to 15 hours. So, this was a new tool that we implemented in Losant, and it is extremely powerful in the manufacturing process, and it is heavily used in the OEE application template. So, let's look at our availability. The first thing I had to do in order to use time at value to calculate availability was to create a device attribute on my paper machine. So, I created a device attribute status as a string attribute, and it has four different options. These are running, planned, unplanned, and sheetbreak. And I have them called out right here in the description area of the attribute, because I like to, when I'm using time at value with a string attribute, have the exact spelling and capitalization of the status states that I'm going to be calling out in my time at value aggregation further on. And then also through the simulation, it'll be spelled and capitalized this exact way, so that I can fully utilize the time at value feature. So, once the status attribute was created, I could then come into my OEE calculations, and I can calculate my availability. So, what I did is I used a data gauge query node, and I performed the time at value aggregation inside of this node over 30 days. So, for 30 days, I'm looking at attribute status, which we just saw in the device, and I'm looking for when it's equal to the value of running. That value is then outputted in milliseconds to my payload at this location that I specified. Now, I did this not only for the running status state, but also for planned, unplanned, and sheetbreak. Because the first step of calculating your availability is to know the total time the machine is actually running or your scheduled run time. So, for the paper machine, I made the assumption that it's going to run 24/7, 365, with the exception of a utility outage. And this utility outage is fairly common in papermaking, and it is an electrical safety outage that is done every year to clean out all your panels and everything, get all the paper dust out, so that you don't have a fire hazard. So, that occurs every year, and in order to find my scheduled runtime, I needed to know my total time, which is the sum of my running, planned, unplanned, and sheetbreak, which you can see here in my math node. I added them all up right up here in this first expression to get my total time. But then I did something different. I did another data gauge query with time at value aggregation on a different attribute. Now, this attribute is reason, and I'm looking for when it's equal to utility outage. So, what is my reason attribute? Reason is an in-depth description of the status attribute. So, every time the status is reported, there is a more in-depth description of that status reported to this reason attribute, which is also a string attribute. This allows for me to get a more in-depth idea of what is actually happening on the paper machine. So, yes, it's a planned downtime event, but why are we having this event? Is it scheduled maintenance? Is it a SKU change? Is it the utility outage? Etc. So, I performed that time at value on my reason attribute, looking for the utility outage, the time spent on the utility outage. Back in my math node, I then took my total time that I calculated in the first expression and subtract the time spent in the utility outage to get my actual scheduled runtime for the paper machine. So, the reason I added this utility outage into my paper machine was to simulate for yourselves, are you going to have different things to omit from your scheduled runtime? So, is your facility going to take into account breaks? Are you going to take into account lunches? That kind of stuff. So, it's a way to remove any time that your planning has said, "Okay, the machine's not going to be running during that time, because the technician won't be there." So, you can subtract that out of your total time to get the actual runtime of the machine. Once you have the runtime of the machine, the calculation is very simple. You are just dividing the amount of time spent running by the scheduled runtime. For the paper machine, the amount of time spent running is the summation of running and sheetbreak time at value that we found earlier. So, running obviously the machine is running. But when a sheetbreak occurs, the machine is still running. It's just creating off-quality product, so we will see the hurt from a sheetbreak further on in the quality metric of OEE. It doesn't count against us twice. It's not counting against us in availability and quality, but just in quality, so it's included in our running portion for the availability calculation. Once I find availability, I then turn it into a percentage, and I save it to a number attribute using the device stage node. I wrote it to the attribute availability. So, that way, it's saved onto the device, and we can track our availability over time, so we have a record of what it was every hour when it's calculated. We have that information. We can see, is it trending up? Is it trending down? Did that change I made make a difference or not? So, what does this look like on our dashboard? Coming over to our paper machine dashboard, availability is right here, and it's displayed in an indicator block. So, you can see the availability of this paper machine is 50%. It's not great. So, as an engineer, I would want to know, why is my availability so low? What is going on? What can I do to increase this number? If I scroll down further onto my dashboard, I can see very clearly my planned and unplanned downtime sections. Now, I'm going to focus in on planned downtime, because I have 170 hours of planned downtime, which is a lot of planned downtime. So, why am I spending so much time down? I can focus in even further and see that, wow, a majority of that time is actually spent on SKU changes. So, now, as an engineer, I have the data to support a claim if I go to planning, and I say, "Hey, we're changing SKUs a lot, and it's really hurting the productivity of the paper machine. Can we work with another paper machine or another site and split up these SKU changes, so that all of the machines and the GPU can be more productive?" If it was an unplanned downtime event, I can do the same thing. I can focus in on what exactly is causing the problem, and how do I go about fixing it to reduce the amount of unplanned downtime events? So, the second metric that we're going to talk about as part of OEE is performance. And performance indicates the amount of time the process is spent at its proven optimal speed. Now, in order to calculate this inside of Losant, I first started out by creating a device tag. So, on my paper machine, I created this tag labeled Max Rate, and the value is 23. So, for this specific paper machine, its max proven speed is 23 tons per minute. Now, the power of putting it in as a tag is you can have different values for different paper machines, and Losant will be able to identify what's the max rate for each individual paper machine by looking at its device tags. The second step to calculating performance, or the second thing I had to do, was create an attribute, and the attribute is called rate. And the rate is the speed the paper machine is currently running. So, it's currently running in tons per minute, so how many tons per minute are coming off of the paper machine? And this is a device number attribute. Once I set those two values up, I was able to come into my OEE calculation workflow, use a mutate node to find my max rate, and pull it off of my device, put it somewhere else. I relocated it on the payload, so that I could find it easier for my future calculations. I then use another data gauge query node, and instead of using a time at value aggregation, like I did for availability, this time I actually used the mean aggregation feature. So, I found the mean value of the rate over the last 30 days, in order to understand what has the speed of my machine been over the last 30 days? It takes into account any kind of slow spells or even times when we're at full speed, just to get the overall rate of the machine for the last 30 days. Once the rate and the max rate have been relocated onto my payload in a place where I can find them, I use a math node to calculate performance. And performance is a very simple calculation. It is essentially the rate over the max rate. So, the rate that I found using the data gauge query node divided by the max rate that's located on my device tags gives me my performance value. The performance value is then also turned into a percentage, the same way I did for availability. And I write it to the device using the same device state node, to the attribute performance. This also, for the same reason, I want to be able to monitor my performance over time. So, what does performance look like on our dashboard. So, in the OEE section, we have another indicator block, and this is just displaying that performance attribute that we just wrote using the device state node. And I can see that it's at 84.6, so 85%, which is pretty good. I mean, the machine is running at a pretty decent speed. But if I was interested in understanding where we were now, where we have been to get a clue of what is really going on with my performance, I can scroll up a little further, and I can see these gauge blocks. So, I have one for the rate over the last 30 days, which shows me I'm running at roughly 19.5 tons per minute. And then my current rate, which is 20 tons per minute. If the machine was running right now, it's... But that was the rate that it was when it went down. So, this is good. I'm looking at this, and I'm saying, "Okay, yes, our performance is at 84.6%, but we've made a move to increase our overall rate for the paper machine. So, I should expect my performance value to begin trending up, because this value is higher, and we're moving closer to our max rate of 23 tons per minute." Now, the final metric for OEE is quality, and quality indicates the amount of good product made without defects or requiring any type of rework. This is also referred to in manufacturing as first-time yield. So, a little bit of background information on a paper machine is that it actually has a vision inspection system that looks for defects in the paper as it goes to the reel. If a defect is identified, the inspection system will tell the machine to break the sheet of paper, which is referred to as a sheetbreak. If the sheet is broken, the machine doesn't stop running, like I mentioned before. But instead, this paper, this off-quality paper that's being created, actually goes into a re-pulper that is located under the paper machine. And the paper is then turned into pulp and sent back out to be reused. So, this paper is being reworked and therefore will count against our quality metric. So, to calculate quality inside of Losant, I created several different device attributes. The first was current tons. So, current tons is a number attribute, and it is the amount of tons that have been created since the last time the paper machine reported to Losant. The same goes for current waste, which would be the amount of waste that was created since the machine last reported data into Losant. These two values are used for calculation of quality. As I jump over to our OEE calculations, you can see that again, I'm using a data gauge query node. Now this time, I'm aggregating based off of the sum of attribute current tons. So, all of the tons that have been created over the last 30 days, or current tons being good quality paper that where you're going to move forward in the process are summed together and put on to the payload. I do the same thing for the waste tons in this data gauge query node. As I talk through the calculation for quality, I'll refer to this current tons attribute value as tons, and that's in reference to good quality tons. And then waste would be paper that's been sent into the re-pulper. So, in order to calculate quality, I first have to calculate the total amount of tons created. And in order to do that, it's very simple. I add together tons and waste, so the quality tons and the tons that are going to be reworked. And that's the total amount of paper that has been created. I report that onto our payload as total tons. In order to find the quality metric, I then divide quality tons, so just tons by our total tons, and that gives me the quality value. Again, I turn that into a percentage further down in my math node, and then I can take that percentage value using this device state node and write the quality value that I found to the attribute quality on my device. Now on our dashboard, again, I'm using an indicator block to see that quality attribute that we just wrote to on our device state node, and I see it's 99%. And I'm very happy with that. If I had a machine running at 99% quality, I'd be going on vacation. It’d be great. But if I wasn't happy with it, if I wanted to make it even better, I could scroll up here to my sheet-breaks area and I can see, “Okay, what are my issues? What is causing my quality problems? So, this pie chart and this indicator block, right here, are actually using the time at value aggregation and the attribute reason. So, what I've done is you can see I've got the 24 hours aggregation. I'm aggregating over 24 hours for the attribute reason. I'm looking for holes in the sheet, flocks in the sheet, an incorrect web tension. That value in milliseconds is then converted into minutes so that when I scroll over my pie chart, I can see, “Okay, I had nine minutes of paper going into the re-pulper due to flocks in the sheet. So, if I was very concerned about those nine minutes of paper, I would have something to go after, I would start investigating why there were flocks in my sheet of paper. In that time at value aggregation is used again here in this indicator block for the same reason. So, now I can use attribute reason to understand exactly why I'm having sheetbreaks so that my technicians or my engineering team know exactly where to focus their attention to increase the quality of my product. Now, once I have those three metrics, they all come together for OEE. So, OEE is, you simply multiply availability, performance and quality to get that overall equipment effectiveness. And that is very simply done in the OEE calculations workflow. So, in this math node right here, all I did was multiplied the performance quality and availability that I had found earlier in the workflow to get my OEE value. I converted it into a percentage, which I then wrote to my OEE attribute on that device. So, now I can trend my OEE over time as well. So, on the dashboard, you can see for the last 30 days, the indicator block displaying my OEE, but you can also see, I have a time series graph here, right below. And that is trending all four of those attributes: availability, performance, quality, and OEE. And it allows me to look at the data, look at it and quickly see, “Okay, my OEE is actually trending up.” So, I've made some moves and they are increasing the productivity of my paper machine. I'm getting more products, more productivity out of the time. So, beyond the template, I went ahead and utilized the same data, the same kind of information that I'm calculating, or I've generated here for my paper machines, but I've taken it further. So, what I'm about to show you isn't part of the application template, but it's what you can do next. There's so much power in the Losant platform that you can make an even more powerful tool for your team. What you're seeing right here is an overview dashboard that I built for, say, an engineer who works in headquarters. And they can log in and look at the screen and say, “Okay, paper machine one is down.” It's indicated here, but it's also indicated on my map. I know where that paper machine is located. But then the other thing they can do is you can compare. So right here, I'm seeing that my paper machine two is running at 21 tons per minute, whereas paper machine three and paper machine one are only running at 17 tons per minute. As an engineer, my first question is why? Why is one machine running four tons per minute faster than the other? What are they doing differently? What is going on on paper machine three that needs to be corrected in order to match or go faster than paper machine two? So, I can then jump right into, we'll just jump right into paper machine two, and you can see I've built... We have a dashboard here that is very similar to the application template dashboard with a couple of different features. The big one is right here in the center, our OEE calculation area. So, what I can do here is calculate OEE over the last 24 hours over the last day. And I can directly compare it to the availability, performance, quality, and OEE over the last 30 days. So, I can see very clearly that my speed has increased, but my availability has decreased. So, something happened, maybe I had a downtime event and I fixed a couple of items, and now I can run a lot faster, which is going to over time increase my OEE, but the value has dropped because I've had that downtime event. Now the way that I did this, create this variable OEE calculation section is I made attributes on my devices, caught with a V in front of them, so variable availability, variable performance, variable quality, variable OEE. In that way, whenever I hit that calculate button on my dashboard, I'll create these attributes and I'm not affecting my availability, quality, performance calculations that I’m monitoring for the last 30 days. So, my trends will still be accurate, because they're not going to be affected by this time change, but I can look at different values to understand if the changes I've made are really making a difference or not. So, this is just one way of using the OEE application template in a manufacturing process. If you wanted to get started using kickstart your own application, you can come right in here. Choose overall equipment effectiveness and get started with your OEE journey. Now send it back over to Aidan for any questions.
Aidan: All right. Thanks very much, Maria. I know we've been through this template a couple times over the past few weeks. But every time that you share it and dive into it, I know I learned a ton more. And I think coming from a manufacturing background like yourself, I think being able to build tools and use tools with Losant that would have helped us in previous lives and reference that experience is one of my favorite things about working for Losant. So, thanks very much for taking us through that. We do have a couple questions that have come through. I want to let Maria catch her breath, grab a drink of water, let everybody process everything that she just took us through before we dive into those. But prior to that, I just wanted to make everyone aware of a couple really important educational resources that we have available here at Losant. We rely really heavily on our Losant documentation. It's written by our engineers who develop the tools and improve upon our platform, and it's just an incredible resource of information to get you up to speed with the platform. We also have Losant University. Losant University is a great educational series that takes you from square one, up to the point of building IoT applications within Losant. It's a series of video tutorials, documentation, and walkthroughs that has just been an incredible resource for us, not only for internal employees but external customers as well. And we're just so thrilled to be able to have that as one of our great assets. Beyond that, we have our Deeper Dive series, which we've been doing now throughout the course of 2020, and we have those hosted on YouTube and on our Losant webpage. And we have a variety of hands-on tutorials and our forums community, which is a great way to interact with your fellow developers and Losant internal experts, like myself, and Taron Foxworth. We're in there daily, helping people really solve those real-world problems with Losant and create the applications that they then get to put in front of their customers. I do want to make note that our Deeper Dive series continues throughout the month of October. So, we will be back on October 20th. I will be joined by Solutions Engineer Julia Kempf. She's going to be taking us through another application template that's being introduced and it's around indoor asset tracking. So, thinking about tracking high-value assets in environments like hospitals or manufacturing centers, and how you can leverage Losant to build those applications. On October 29th, I'll be joined by Dylan Schuster. Dylan is Losant director of product and platform, and we have a great introducing level series planned for October 29th, around the introduction of our template library. So, very excited about that, please be sure to register at losant.com and we'll see you later on in October. Now with that, I want to open it up with Taron and Maria again, to get into the Q&A. Please continue to use the chat feature as we continue this discussion to pepper us with more questions. We'd love to be able to interact with our users like this. The first one that I want to tee up and, Maria, I’d like to have you speak to this a little bit is once you have this template in hand as an engineer and a manufacturing center, what are those steps that you need to take to get the data from your machinery, from your equipment up into Losant? How can you really leverage this template to really customize it for your application? And then, Taron, I'd love for you to give us a sense on, beyond just even the manufacturing space, what are the different ways that users can get data into Losant? But first, Maria, could you speak a little bit about how we can customize this template?
Maria: Sure. So, one of the powerful things about Losant is our device. We are device agnostic. So, if you have a device, if you have a manufacturing system already in place, we can connect to it. Now you can connect to it through multiple different ways. You can use an Edge Compute device, which is what we have here for what we would probably do for a paper machine. Or you could even connect directly using Modbus, OPC UA. There's many ways to get the data to Losant. Then once it's in Losant, we can perform any of these calculations and so many more, in order to display exactly what you're interested in seeing and put it in front of the right person. So, you could even have a dashboard for a technician or a dashboard for an engineer. Like I was saying, with the ability of being, I lost my words, device-agnostic allows us to really connect to any device you currently have. We will find a way to do it. But a lot of times in manufacturing, we use an Edge Compute device, and then through MQTT send it to Losant.
Aidan: That's great. Yeah, I think one of the really powerful things about Losant that even for somebody coming in, who's new to IoT, is the ability to not be locked into a particular set of hardware. And because we offer so many various integrations with various communication protocols, it really keeps the door wide open for a variety of applications across a variety of industries and verticals. Taron, could you speak a little bit beyond even the manufacturing space that I was talking about, the variety of ways specifically that we integrate with communication protocols and different ways of getting data into the platform.
Taron Foxworth: 100%. Just confirming, are you able to hear me?
Aidan: I am. Yeah, thank you.
Taron: Awesome. Thank you. Hello, everyone. As Aidan mentioned, I'm Taron Foxworth. So, just to provide some context about how data gets to Losant, generally, the two magic words are HTTP and MQTT. However, that doesn't quite explain how the interaction with the PLCs occur. So, Aidan, would you mind pulling up the supported protocol documentation?
Aidan: Yeah, sure.
Taron: So, what Aidan is pulling up is going to be our documentation for Supported Edge Protocols. So, one cool part about Losant is the Losant Edge Agent. The Edge Agent allows you to install a tool in your environment that has access to the PLCs. The Edge Agent, Maria showed workflows at Losant, you're able to push workflows from the cloud down to that agent. And once those workflows are running on that agent, you can tap into the PLCs, because this Edge Agent is now within the same local network as those PLCs. So, the communication between the end devices and the Edge Agent, that is what you can see here listed. So, you have locally and in the Edge environment, you have MQTT, HTTP, Serial, UDP, Modbus, OPC UA, and all the other protocols we listed today. So, Losant can immediately, once you get the Edge Agent installed in that environment, configure the nodes and configure the Edge Agent, you're easily able to use any of the protocols that you see here. And also, we really appreciate feedback from our customers. So, if there's something on this list that you use and don't see, let us know and we'll be able to get that into a feature request into the platform. So, we can tap into any types of PLCs that exist.
Aidan: Great. Thanks, Taron. The next one up, Maria, I know you touched on it a little bit about scalability, and how you could apply this template not only to a single machine on a manufacturing floor, but to a variety of machines on a single floor, or even broadly, looking at a global supply chain of paper machines. But could you speak a little bit around the use of context variables in your dashboard, and how you can really modify how you can look at a specific set of paper machines within this type of template?
Maria: For sure. Would it be easier if I share that, my screen?
Aidan: Yeah, absolutely. That'd be great.
Maria: Okay. Let me take “share” again. Okay. So, what Aidan was just mentioning, as context variables in the power of the context variables with our dashboard is it allows you to actually just build, if I come here into my dashboards, I just have the one dashboard. When I come inside of it, I can look at three different paper machines, so I can look out, or the GPU as a whole. So, the way that that is set up, if I come into my Edit Settings, I can create this context variable, and it's based off of the device ID. So, every device ID, instead of putting in paper machine one, we're going to put context device ID-0 in, and then we can select the device that is going to fill that spot, essentially. That's a bad way of explaining it. But if you utilize that context variable in all of your dashboards, if I just choose any of these blocks -- I’ll choose the machine runtime block -- you can see here that instead of selecting a device, I selected a context variable. So, that device ID context variable that I already created. And that allows the same dashboard to be utilized for an infinite number of paper machines. Every one of my dashboard blocks references that context variable. So, if I were to come and switch from paper machine one to, say, paper machine three, you'll see the data updated to the correct information for that paper machine that I selected, but it's the exact same dashboard. It's just filling in the correct data for that machine itself.
Aidan: Thanks, Maria. I think like when you think about how this template would actually be used on a manufacturing for, when you want to be able to make decisions as close to as real-time as possible, you gave that great example of “I'm a technician, what is the key information that I need to see so that I can get on with my day?” Anybody who has spent time on a manufacturing floor knows that being monitored in terms of efficiency down to the minute is essential to really be keeping up that productivity. So, I think being able to leverage Losant’s dashboards and context variables, to identify not only the particular variable that is of most concern to that technician, or to that engineer, but also to be able to customize that to a particular set or of devices, to me is just a huge improvement on how we can get this really meaningful information into the right hands of the right people. So, I love being able to leverage the context variables feature within this application template. So, it looks like we've got one more question here. And I will open this up to both, either Taron or Maria on this one. But one of the challenges that Losant has seen with working with a variety of PLCs, I think there's a legacy manufacturing, and then there's new manufacturing -- there's modern manufacturing -- and with the digital transformation of IoT, really touching many, many aspects across industries, there may be a sense that there's some competition within remote monitoring and different capabilities there. So, could you speak a little bit to how we've addressed being able to integrate with a variety of different communication protocols? I know, Taron, you mentioned this a little bit with what we support. But you guys, could you maybe speak a little bit more to that?
Taron: Yeah, yeah. This is a really great question because that mapping is super important. Maria, would you mind pulling up your dashboard with the device state node? However, that node is where the mapping occurs. So, generally, what happens is that your PLC is collecting data already and through a workflow, we can map that data to what it's represented on a PLC to where it should be in Losant. So, here, the example that Maria is showing, in this workflow, she's calculating OEE and in the workflow, we get those calculations. On the left, we're able to specify what attribute that is. The top one is availability. Then on the right, we're able to say, “Okay, well, in my workflow, I'm calculating this data, or on the Edge, the data that's in your workflow may come from the PLC itself. Once that data is on the payload, you're able to map it from the data you have in the workflow to the attribute that's in Losant. Once you make this mapping and report state, that's when all of the rest of Losant kicks in. You can put that data on dashboards, go to experiences, use context variables, and really build your application on top of that. And the one other thing to add is really, I like to think of Losant as a data of platform. Typically when working with these PLCs and getting that data into Losant, that's generally the first step, it’s using Losant's Edge Agent, building Edge workflows, to read that information, and then using this node, as you saw here, to make that connection between Losant attributes and then that all flows to the cloud properly.
Aidan: Great. Thanks, Taron. So, it looks like we're at a point where we've exhausted the questions. I really appreciate everybody's time today, this afternoon, especially in this crazy 2020, being able to carve out time to really dive into this OEE template. I really want to thank Maria for offering up her time and her expertise, and for Taron, for joining us for the Q&A. I think having your expertise and your know-how on how the platform functions is always incredible to get to hear that direct experience. With that, I want to thank everybody again for your attendance. As I said, if you have any particular questions or specifics to your application, that maybe we didn't get to touch on today, or you just want to learn more about Losant in general, please reach out and contact us. We're happy to have those conversations, and we're really eager to have those conversations. And again, October 20th, we have our next Deeper Dive on Indoor Asset Tracking, and on the 29th, we'll be introducing that template library. So, with that, I will call it a day, and I will see you all later in the month of October. Thanks very much.