
Today’s platform update helps reduce bandwidth between the Gateway Edge Agent and the cloud, and also adds some new tools for debugging device activity.
CBOR Encode & Decode Nodes
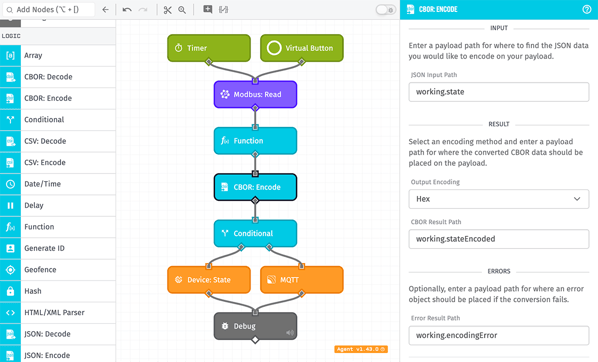
First, we’ve added support for Concise Binary Object Representation messages through the new CBOR: Encode and CBOR: Decode workflow nodes. CBOR is a popular format for shrinking the size of JSON payloads, and through these new nodes, users can reduce the bandwidth of messages between the Gateway Edge Agent and Losant’s cloud platform, resulting in lower connectivity costs.
In an Edge Workflow, construct a JSON payload to send to the cloud – such as a device state report or a message on a custom MQTT topic – and run the payload through the CBOR: Encode Node.
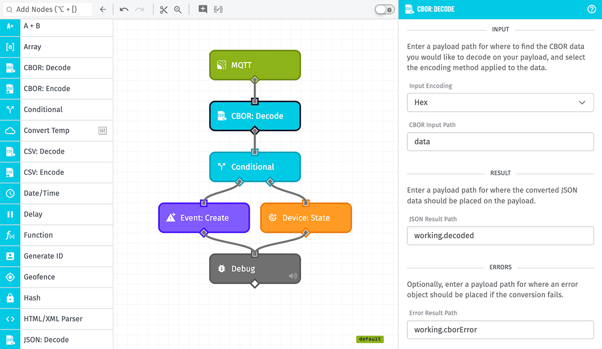
Then, in an Application Workflow triggered off that topic, the original content can be parsed back into JSON using the CBOR: Decode Node, and the payload contents can be saved as device state or used otherwise to modify your application.
Rollout of these nodes can lead to a significant cost savings for large-scale IoT applications as most cellular connectivity providers charge based on data bandwidth; CBOR encoding can reduce bytes transferred by 10% to 40%. We recommend considering these new nodes if connectivity costs are a major factor in your solution.
Device Activity Log Enhancements
Today’s release also includes several enhancements to the debugging panels available on a device’s overview page
- The device connection log now displays the IP address from which the connection to the MQTT broker was made. This can be especially helpful in tracking down multiple clients connecting to the broker using the same client ID / device ID.
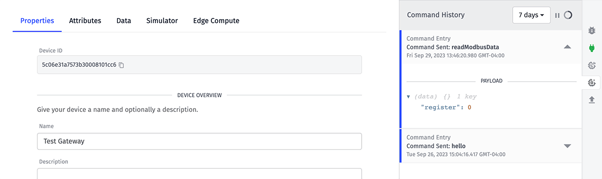
- We’ve added a command history panel that displays the names, payloads, and times of commands sent to the device. While the panel does not reflect whether the device received the command, it does expose activity around this common method of communicating from the cloud to the device.
- The connection log, state report log, and new command history panel now allow for defining date ranges to display activity for. The existing panels previously returned the last 25 items of activity regardless of time range, which may not be helpful depending on when the events you wish to look into occurred and how active the device has been since that time. Now, users can select durations relative to the current time or select a custom time range to view.
The goal is to make it easier for our users diagnose hardware issues and resolve them with less effort, and we are confident these updates deliver on that goal.
Other Updates
As always, this release comes with several minor features and improvements, including:
- Organization invitations can now be accepted or rejected from the user’s account overview screen, and pending invitations are indicated on the User Account menu item.
- We’ve added per-application usage statistics to an organization’s payload and notebook minute usage screens. This helps identify which applications are behind increases in resource utilization, making it easier to track down and take action before overage fees kick in.
- We’ve also added the same detailed payload, notebook, and application resource tracking information for sandboxes. Having this information available for your personal IoT projects is especially helpful, given that sandboxes cannot exceed their monthly payload allotment.
- Per a user request, Image Overlay Blocks now have the ability to disable zooming behavior. This gives dashboard developers more control over how their IoT data is presented and also prevents users from getting the block into a state that skews the presentation of that data.
Template Library Updates
We’re continuing to grow our Template Library with new entries designed to demonstrate Losant best practices, shorten time to market, and improve end user experience.
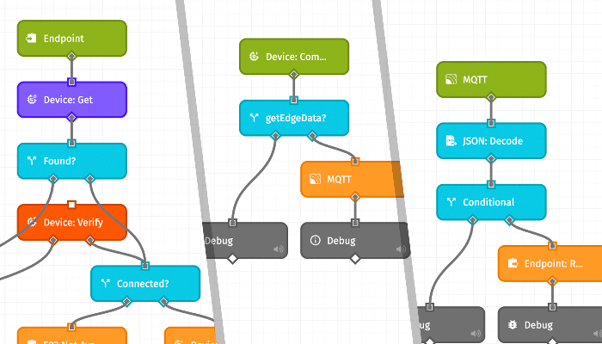
We recently added an Endpoint Retrieving Edge Data template that demonstrates how to fetch data on demand from an edge compute device in response to an experience endpoint request. While the experience user’s request is held open, a command is sent to the device to retrieve the requested data, which is then published back to the cloud on a custom MQTT topic. From there, the data is sent as the reply to the pending request.
While we recommend persisting any necessary application data to the cloud, many users have requested a demonstration of this complex roundtrip from the cloud to the edge and back to the cloud. Exposing this as a template allows it to be imported into an application and modified for each user’s specific use case.
What’s Next?
With every new release, we listen to your feedback. By combining your suggestions with our roadmap, we can continue to improve the platform while maintaining its ease of use. Let us know what you think in the Losant Forums.