
Today’s platform update makes workflow debug output more consumable, adds a new node to assist with application logging, and provides several other improvements to our platform.
Workflow Debug Message Filtering
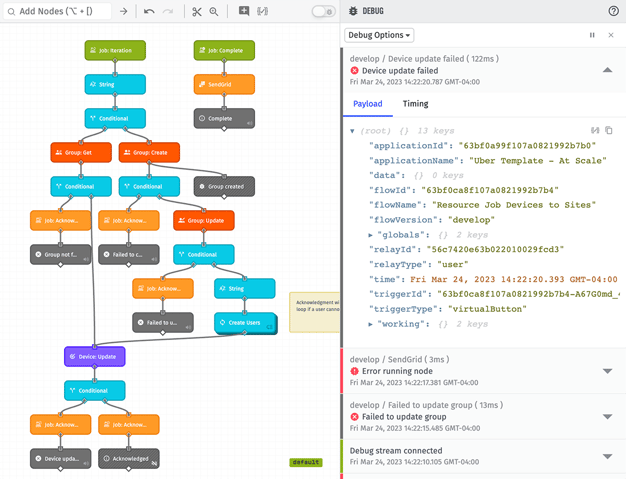
Today’s release introduces debug message verbosity settings, which allow for the categorization and quick filtering of debug output by those types. Each Debug Node’s message can fire as one of four standard levels (Verbose, Info, Warning, Error), and users may reduce the messages hitting the debug log to one or more of those levels.
The sheer number of messages that appear in a high-volume production workflow’s debug panel can make it impossible to identify, diagnose, and resolve unintended behavior - especially when that volume triggers debug throttle limit messages. We’ve seen users temporarily strip out Debug Nodes one at a time to get around this problem, but that is tedious as it requires re-attaching the nodes that led into and out of the deleted node. Workflow debug verbosity is a quick and easy solution to this problem.
Reducing debug log output is a standard tool used by all software developers. It translates well to crafting Losant workflows: it allows our users to hone in on the conditions that matter to them at any stage of the development process, just as other professional coders do.
Additionally, there are a couple of other platform behavior changes that coincide with this update:
- Individual Debug Nodes can be temporarily muted on the stage for even more control over what deserves your attention.
- Function Nodes also respect the user’s selected verbosity output through
consolemethods; for example,console.warn()will appear as a warning-level message in the debug panel (but only if Warning-level messages are enabled). - If displaying debug messages from Custom Nodes, those messages also will only appear if the inner Debug Node firing the message matches the user’s chosen output settings.
As we undertook this change to reduce the noise in the workflow editor, we took an added step to also move the Debug Node to its own category and node color. Previously, Debug Nodes on the stage did not stand out from other output nodes in a workflow; they just blended in with Endpoint: Reply Nodes, Device: State Nodes, and other critical elements. Applying the Blur Test to a workflow before and after this change significantly improves the at-a-glance interpretation of the workflow and its intended behavior, as you can now look past all the Debug Nodes and focus on the actual functionality you are delivering for your IoT solution.
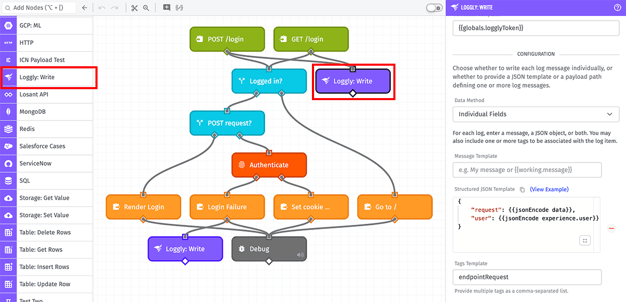
Loggly: Write Workflow Node
Next, this release includes a new way of tracking application activity with the addition of the Loggly: Write Workflow Node.
Loggly is a popular application logging service acquired by SolarWinds in 2018. The company specializes in ingesting massive volumes of structured or unstructured data - usually representing inbound application requests, program errors, and outbound messages - and presenting that data to software developers and system administrators in an organized, aggregated way. That makes it a great fit for IoT solutions built on Losant, given the amount of traffic generated by MQTT messages, third-party service integrations, and end-user HTTP requests.
One of the first Custom Nodes we developed - and eventually added to our Template Library - was a wrapper that sent messages to Loggly. The node has always been one of our most imported library templates, and we decided it was time to convert it to a first-class Losant workflow node. Existing Loggly custom nodes will continue to function, though we recommend moving to the new node for several reasons:
- Users can now send custom string messages along with structured JSON.
- The new node supports sending multiple messages in one invocation.
- Each message can also include one or more tags for organizing messages by type, source, and priority.
Usage of the node requires a Loggly account; the service offers 200MB per day of free data ingestion, which is more than enough for most mid-sized applications built on Losant. That, combined with how easy it is to integrate this node into your existing workflows (since logging activity should be treated as a parallel, unblocking process as depicted in the screenshot), makes this a simple and worthwhile addition to your existing IoT solutions.
Job Iteration Retries
Today’s release includes one more improvement to our Resource Jobs feature: the ability to automatically retry an iteration in the event of failures and/or timeouts.
As we’ve been rolling out Resource Jobs to our internal applications and speaking with users adopting the feature, it’s apparent that many use cases are subject to occasional random failures when working with third-party APIs. This can lead to necessary processes that are only mostly completed through the use of a Resource Job, which then requires manual intervention to correct the failed iterations or living with the result until the job runs again.
Now, a Resource Job can be configured to retry an iteration that times out or is marked as a failure, with the option of adding a delay before kicking off the retry. In our usage, this has led to a much higher per-item success rate and more efficient processes, as most of these issues get resolved by simply kicking off the third-party service request a second time.
Other Updates
As always, this release comes with a number of smaller feature improvements, including:
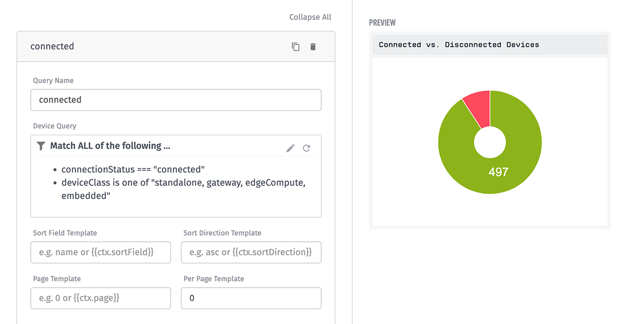
- The Custom HTML and Custom Chart dashboard blocks now support device metadata queries as inputs, exposing an array of your application’s devices (with IDs, names, tags, connection statuses, and composite states) as graphable data. This allows for rendering more highly customized HTML tables, pie charts depicting the number of connected vs. disconnected devices, hierarchical relationships and associations between devices, and other visualizations.
- Time Series Graphs now have the option to disable the graph’s duration and resolution selectors in the dashboard view. This helps developers lock down data they may not wish to expose to their users, and also provides a method for cleaning up some repetitive UI elements by removing that selector from your graphs.
- The Redis Node now supports cluster connections - a standard setup in large-scale applications, both in the cloud and on the edge.
- Workflow versions now display the “Notes” that can be entered when creating a new version. A few users pointed out that this description was never visible in the platform interface after creation, so we now include it in the workflow’s Versions tab.
What’s Next?
With every new release, we listen to your feedback. By combining your suggestions with our roadmap, we can continue to improve the platform while maintaining its ease of use. Let us know what you think in the Losant Forums.