
Our dashboards have always been an awesome way to visualize and monitor your IoT solutions. However, if you wanted to view a specific time window or quickly toggle between different devices and attributes, they weren't the best approach. Today we're proud to announce the Data Explorer, which provides a powerful way to quickly inspect your IoT data.
As an example, let's look at last week's weather in Cincinnati, Ohio. This data is also available on our Cincinnati weather public dashboard.
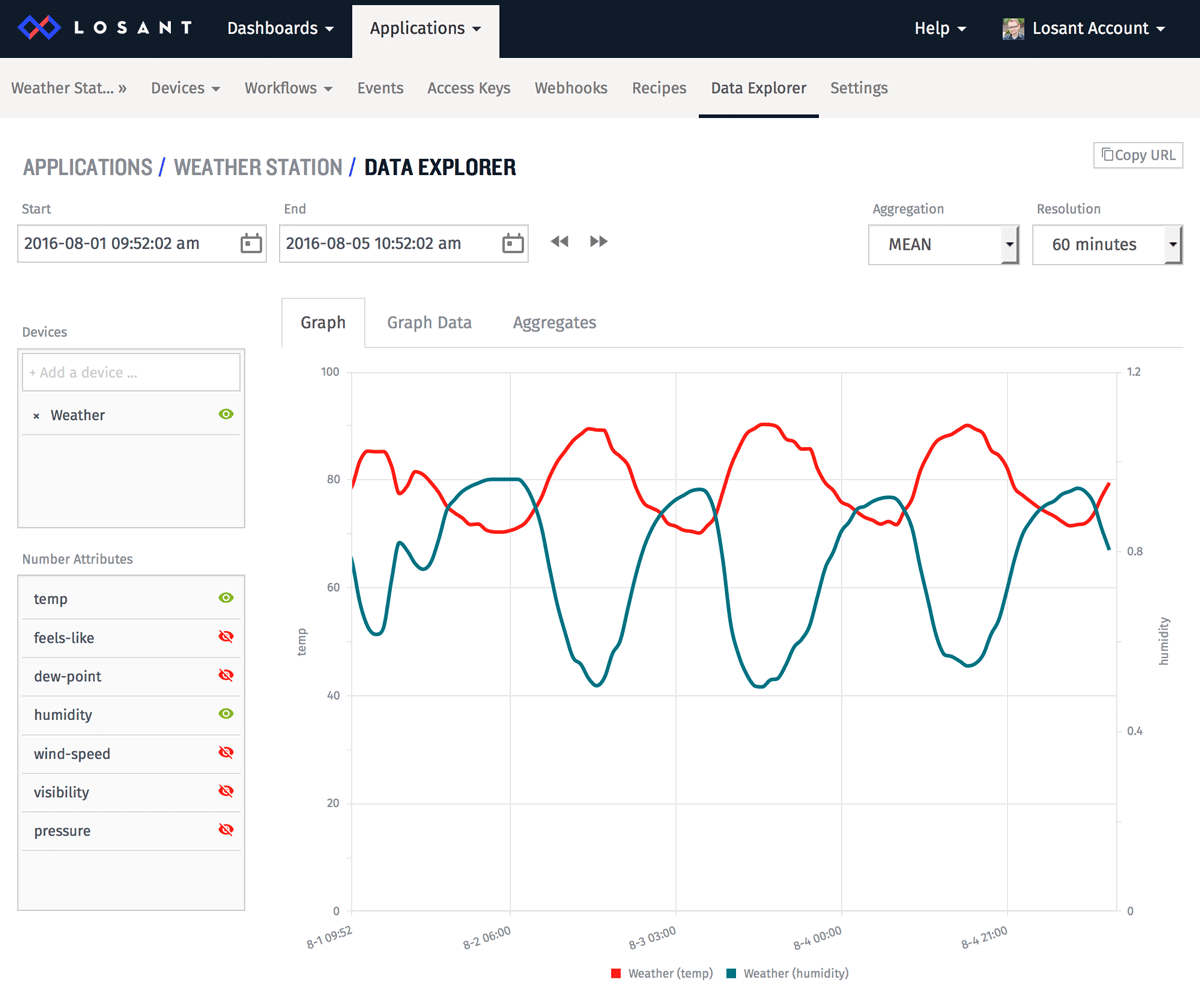
Unlike the dashboard, the data explorer allows you to choose specific time ranges and quickly toggle devices and attributes to view. In the above example, I'm graphing the temperature and humidity between Monday and Friday of last week.
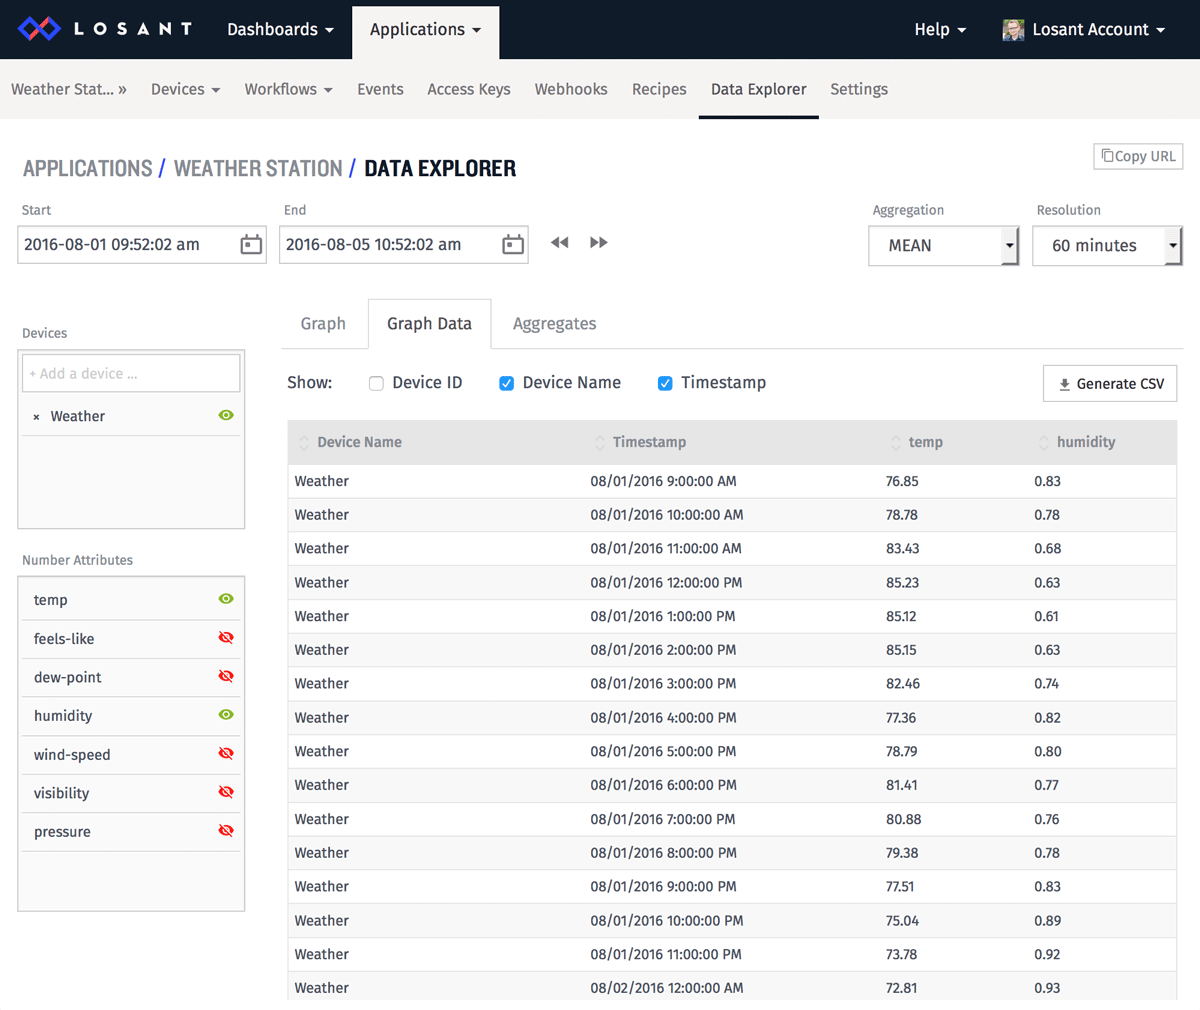
You can also view the data as a table and instantly export it to CSV for external processing.
The first release of the data explorer is limited to viewing numerical attributes. Other data types, like GPS, will be coming in future releases.
What's Next?
With every new release, we really listen to your feedback. By combining your suggestions with our roadmap, we can continue to make the platform easy for you. Let us know what you think in the Losant Forums.