
Among other things, today's release brings some much needed visibility into how much of the Losant platform you're consuming. We've rolled out usage tracking for the application, user, and organization level.
Usage Tracking
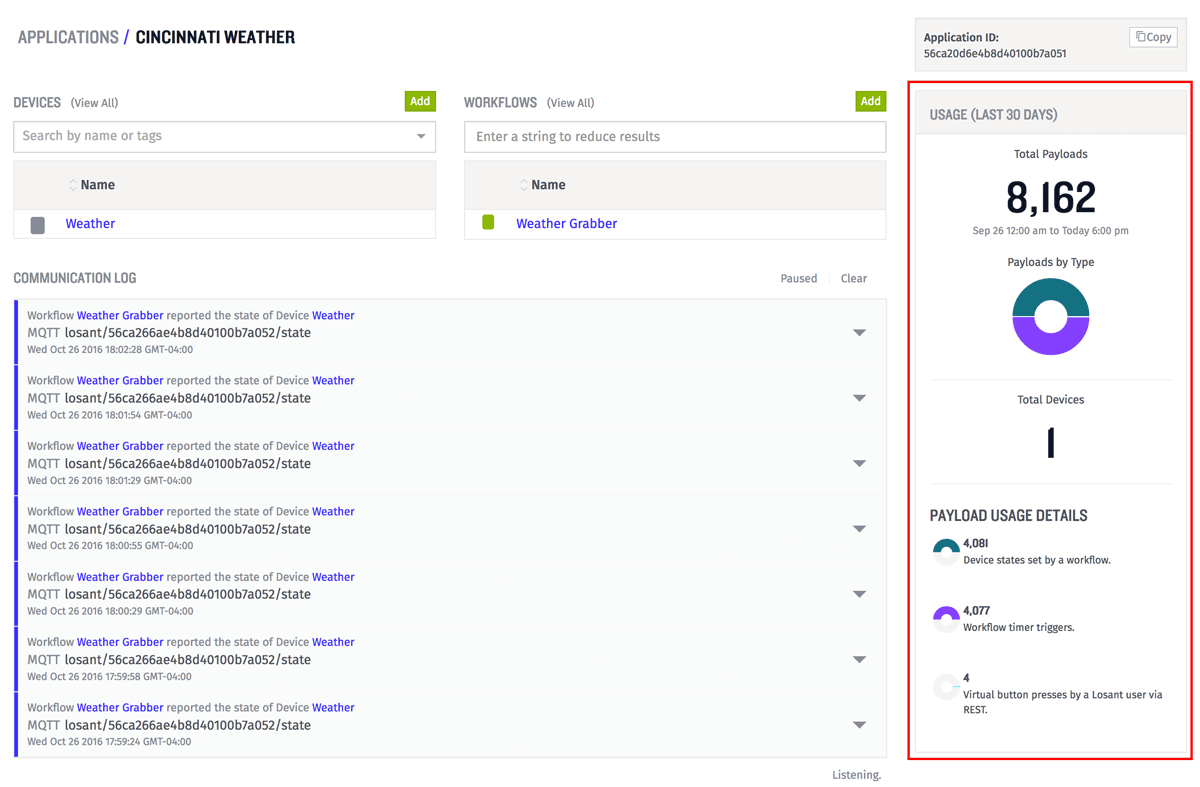
There are now three places within Losant that display the last 30 days of platform usage: application overview, organization overview, and a new usage tab in your account settings.
Usage tracking is reported as the number of generated payloads. There are many ways to generate a payload with the most common being a device reporting its state. There are a few exceptions, but generally a payload is created by performing any action that could invoke a workflow. We'll have full documentation with detailed explanation of all payload types coming shortly.
Multiple Values For Indicator Block
The indicator block has been updated to allow multiple attributes from multiple devices when deciding the block color and text.
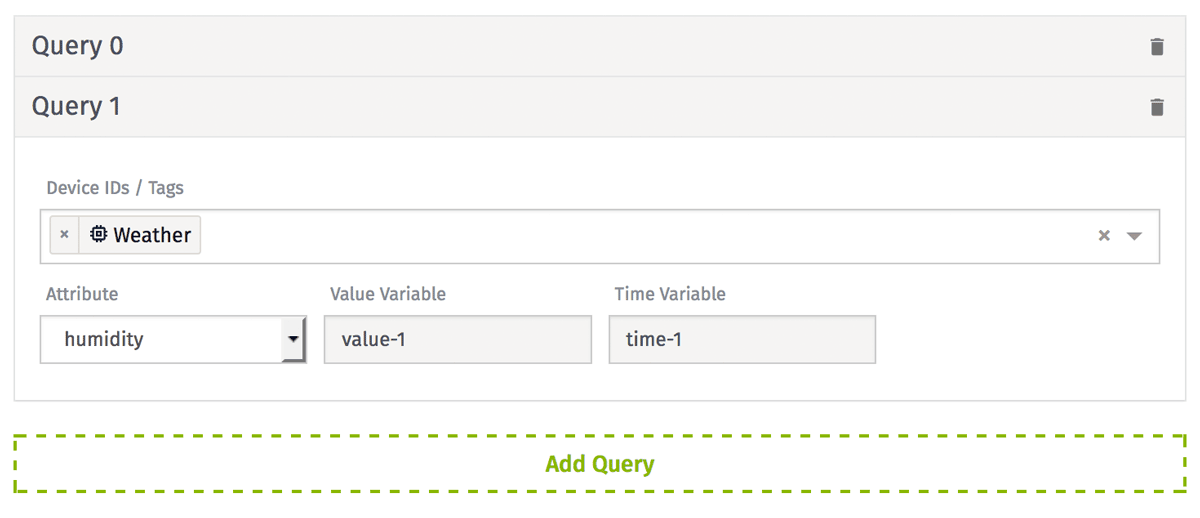
The example above uses two queries to obtain the most recent temperature and humidity from a weather station. These values are stored in variables "value-0" and "value-1".
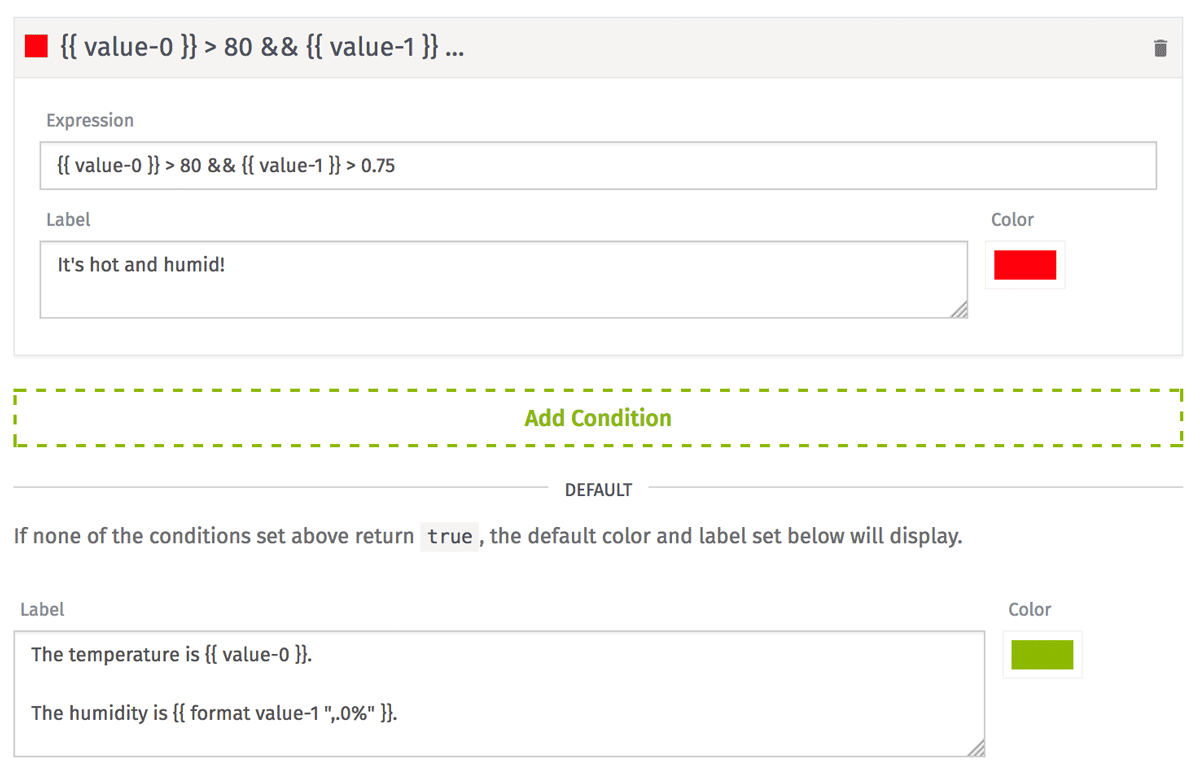 You can then use both values to determine when to change the indicator to red. In the above example, the indicator block will only change to red if the temperature is more than 80 degrees and the humidity is more than 75%.
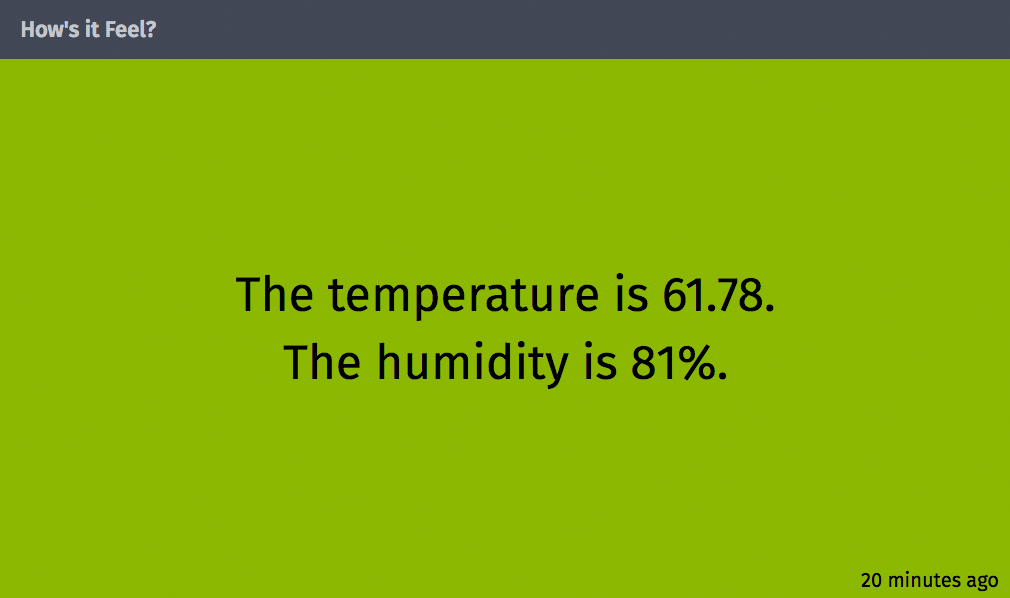
Along with using multiple values in conditions, you can now display multiple values on the indicator block.
Cumulative Line Graph
Time series graphs now have the option to display a cumulative version of the data.
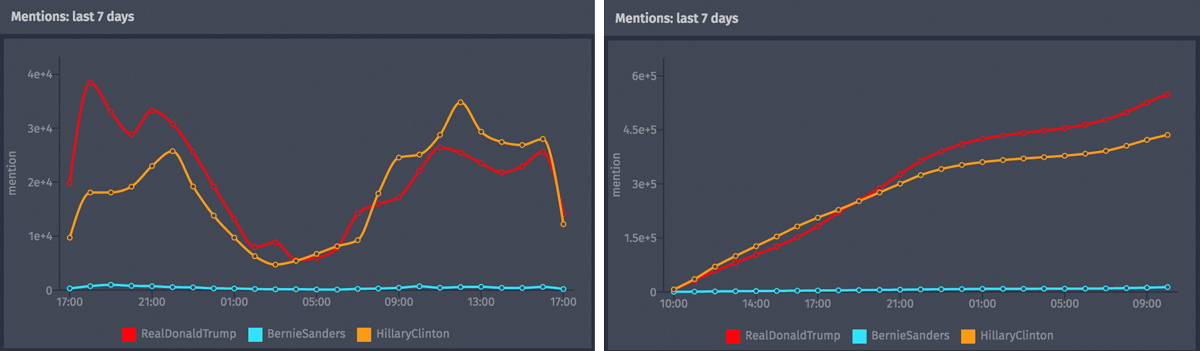
The example above shows two different ways to represent the number of tweets mentioning some of the presidential candidates. The left graph is the default view, showing the number of occurrences each hour. The right graph is the now available cumulative view, which shows the total number of occurrences as it increases over time.
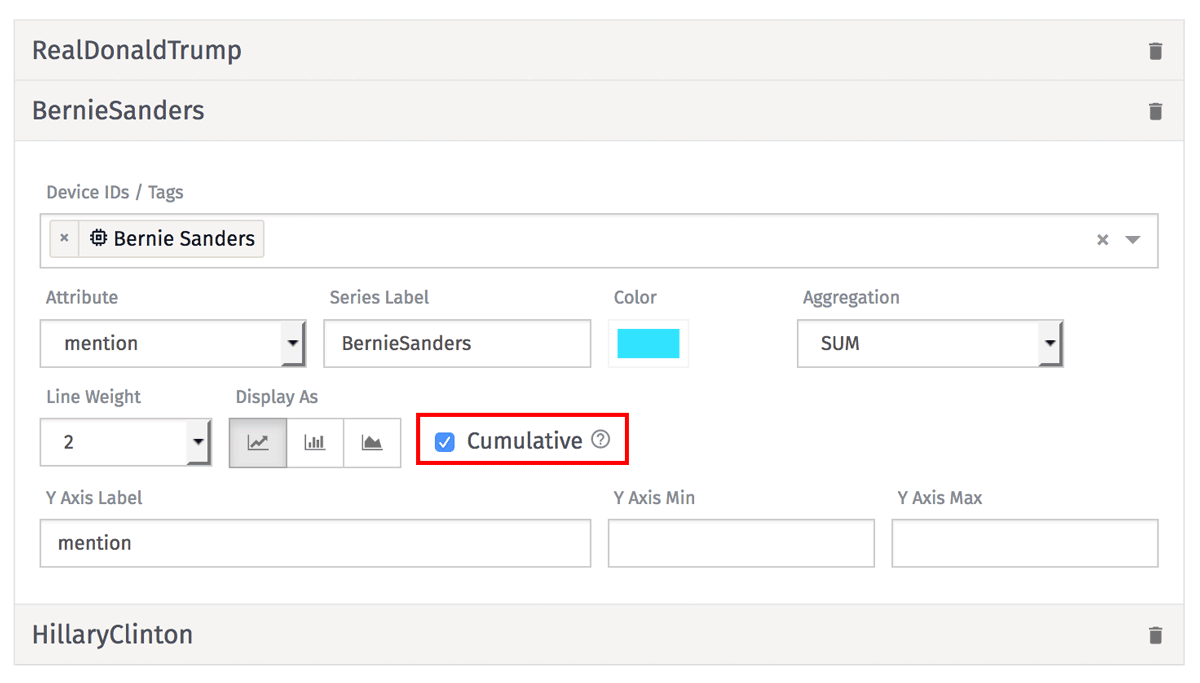
The new cumulative option can be enabled or disabled independently on each series.
Random Number Workflow Node
You can generate random numbers using the new Random Number workflow node.
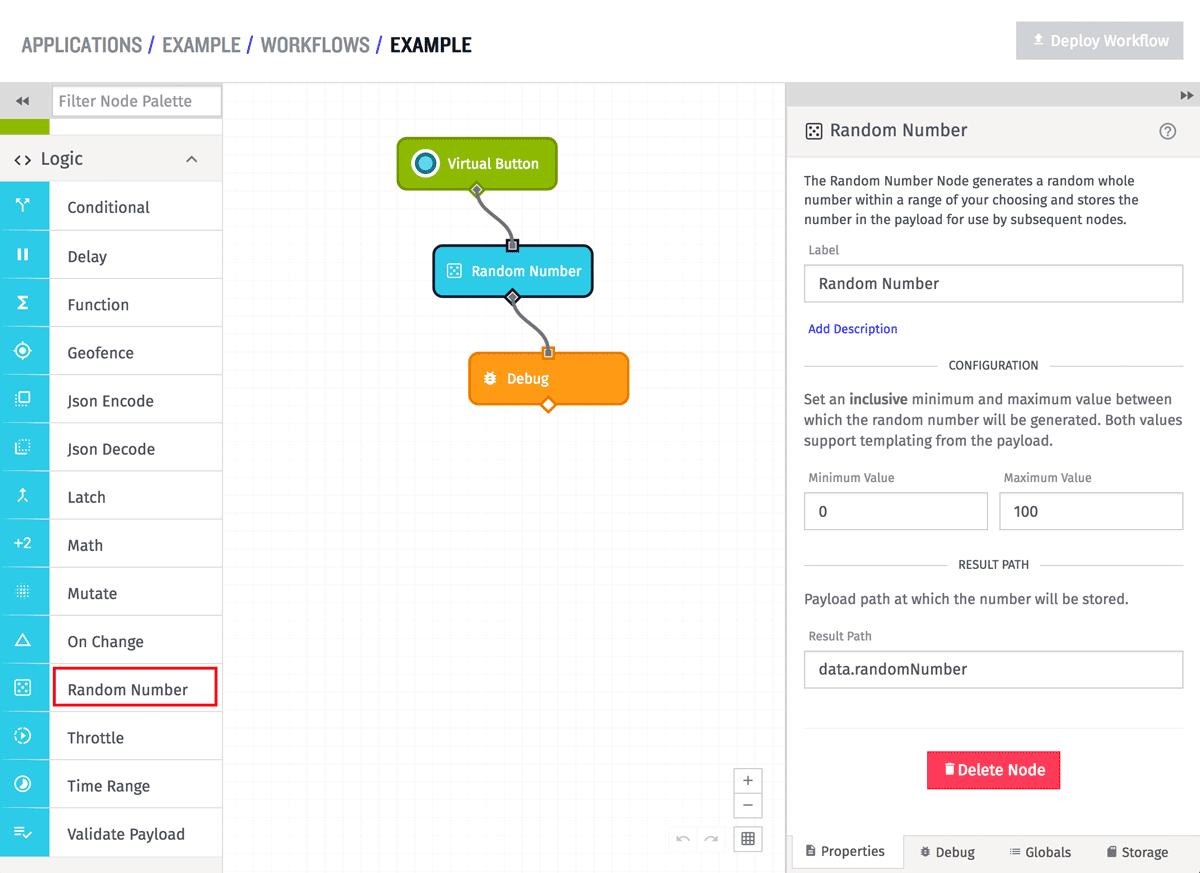
The node can generate a random number between any specified range and outputs the result on the payload.
Other Updates
This release also includes many other bug fixes and small features.
- REST endpoint for device state now accepts arrays.
- base64 template helpers.
- Minor UI tweaks and fixes.
What's Next?
With every new release, we really listen to your feedback. By combining your suggestions with our roadmap, we can continue to make the platform easy for you. Let us know what you think in the Losant Forums.