Today's platform update makes it easier to quickly visualize time series data across time durations on your dashboards. We've also expanded the functionality of our workflow engine with new triggers, nodes and helper methods.
On-the-Fly Time Series Changer
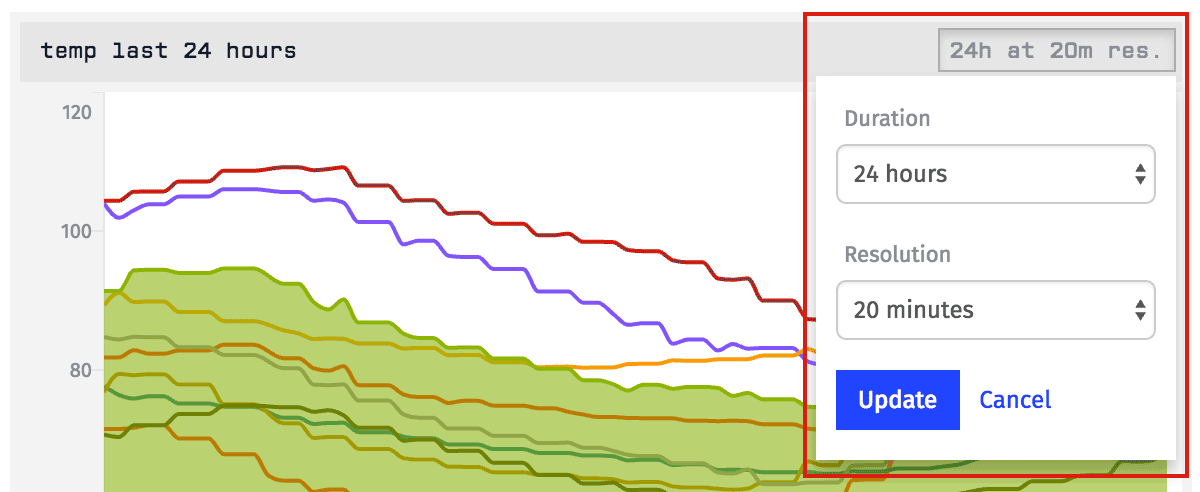
We've seen many of our users build dashboards with multiple time series graphs all visualizing data from the same devices and attributes, but graphed at different durations and resolutions. Clearly, users were looking for a way to visualize short-term device data and, if an anomaly were present, to look back over a longer period to see if this were a trend or just a blip.
Thanks to a suggestion in our forums, we've added an on-the-fly duration / resolution changer to our time series dashboard blocks. This allows dashboard viewers to quickly change the time range and point size on any time series graph (streaming blocks excluded).

This feature falls under our mission to improve "information density" within Losant dashboards, as it allows our users to remove redundant blocks from their dashboards and free up that space for other data visualizations.
Inactivity Trigger
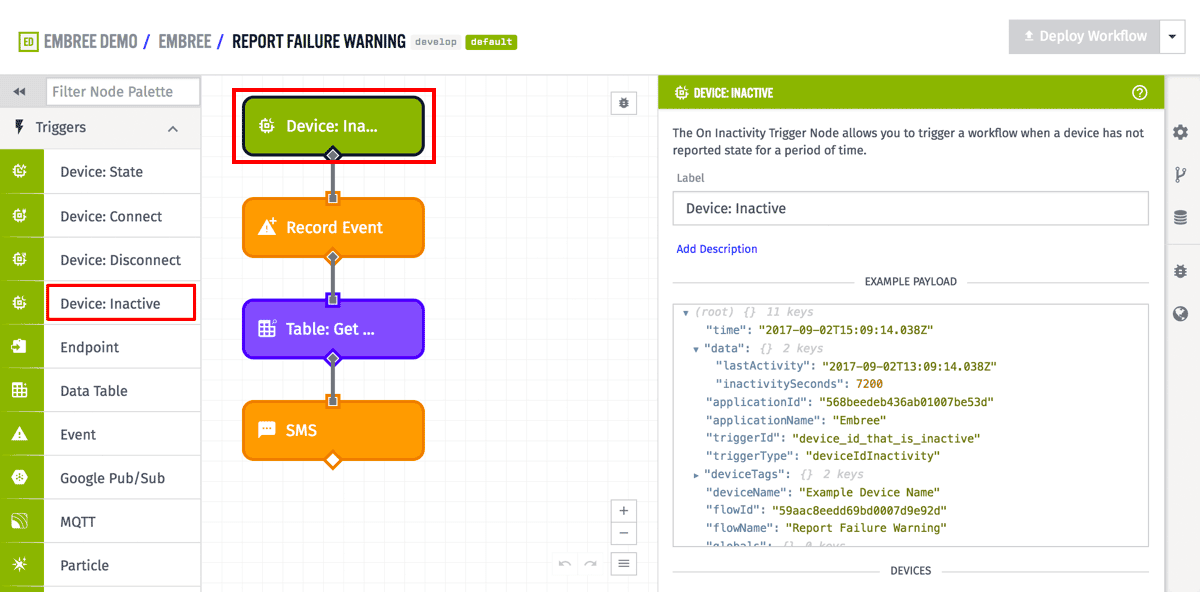
Thanks to another forum suggestion, we've added a Device Inactivity Trigger to the Losant workflow engine. If a device fails to report state within a time range you define, you can now kick off a workflow to (for example) notify a person via SMS, force-report the device's state or delete the device.

The trigger behaves similarly to the Latch Node, in that it will only trigger once per inactivity period. Once the device reports state again, the trigger's timer will reset and will fire again on the next period of inactivity.
String Node
"Function Nodes are a last resort" is the mantra of the workflow development team. If many users are deploying Function Nodes to perform similar operations, it's time to write a new node to make their lives easier. For example, we recently released an Array Node for this very reason.
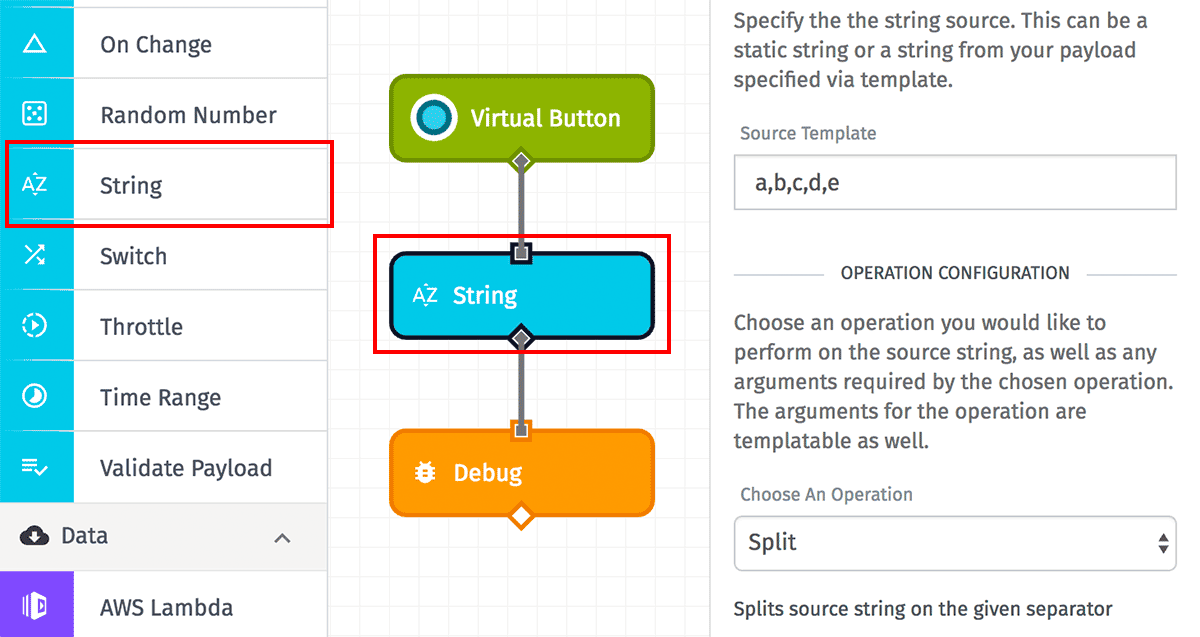
Now, we're eliminating another common Function Node use case by introducing the String Node. Users can now find and replace values, split strings into arrays and more.

Other Updates
- Expanding on the ability to embed individual dashboard blocks into third-party sites, we've added the ability to embed entire dashboards in the same manner. The embedded dashboard includes all of your dashboard blocks without the Losant header and footer or dashboard time controls. This feature comes from a forum request, as well as our seeing many users embed multiple blocks from the same dashboard on one page, essentially recreating their Losant dashboard.
- The Store Value Node has some new helper functions, such as incrementing and decrementing values and casting string templates to different variable types.
- We've added a Delete Device Node to the workflow engine.
What's Next?
- Our next release will make it easier to test how your devices' state reports and connection events trigger workflows, and what effects those workflows have on your applications. More details to come.
- We're hard at work expanding our application experience functionality – more specifically, making it easier to publish dashboards to your experience users. Expect that to land in the next couple months.
With every new release, we really listen to your feedback. By combining your suggestions with our roadmap, we can continue to make the platform easy for you. Let us know what you think in the Losant Forums.
