
Visualizing device data is a core aspect of most IoT solutions. Today's update enriches your ability to display data by adding several new features to Losant's built-in dashboarding functionality. These include a new Custom Chart Block, the ability to downsample GPS data based on time, and new line types for the existing Time Series Graph Block.
Custom Chart Block
Losant dashboards are one of the easiest ways to visualize IoT data. Every now and then, however, we receive customer requests to present data in a way that's not supported by our built-in blocks. With the introduction of the Custom Chart Block, which is powered by Vega-Lite, you now have much more power over customizing exactly how you'd like to present information to your users.
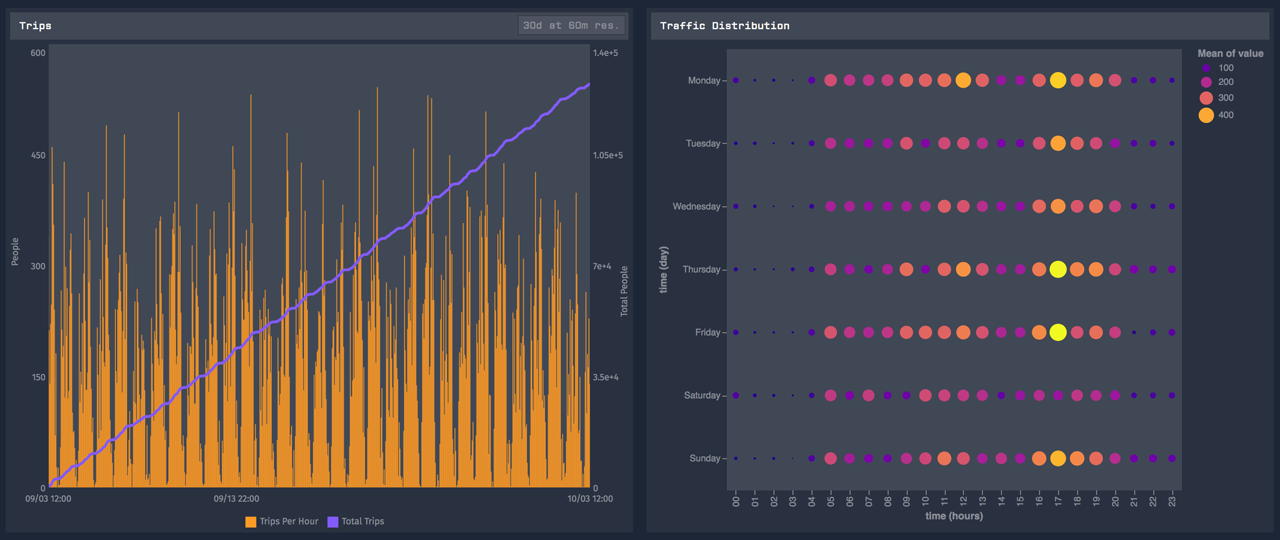
The above screenshot shows an example of a Custom Chart Block (right) next to our built-in Time Series Graph Block (left). The same information is used for both graphs, which is the count of people walking through a door over 30 days. The left block is showing the raw activity, which is useful, but doesn't provide any real insights into the data. The right block, which is based on Vega-Lite's Table Bubble Plot example, is grouping that same information by day of week and hour of day. This provides a very clear visual of the most active times for this particular area of the building.
Custom Charts are built by querying one or more Losant datasets and then providing a Vega-Lite configuration that controls how to present that information. Custom Charts can be populated with time series, gauge, or data table information.
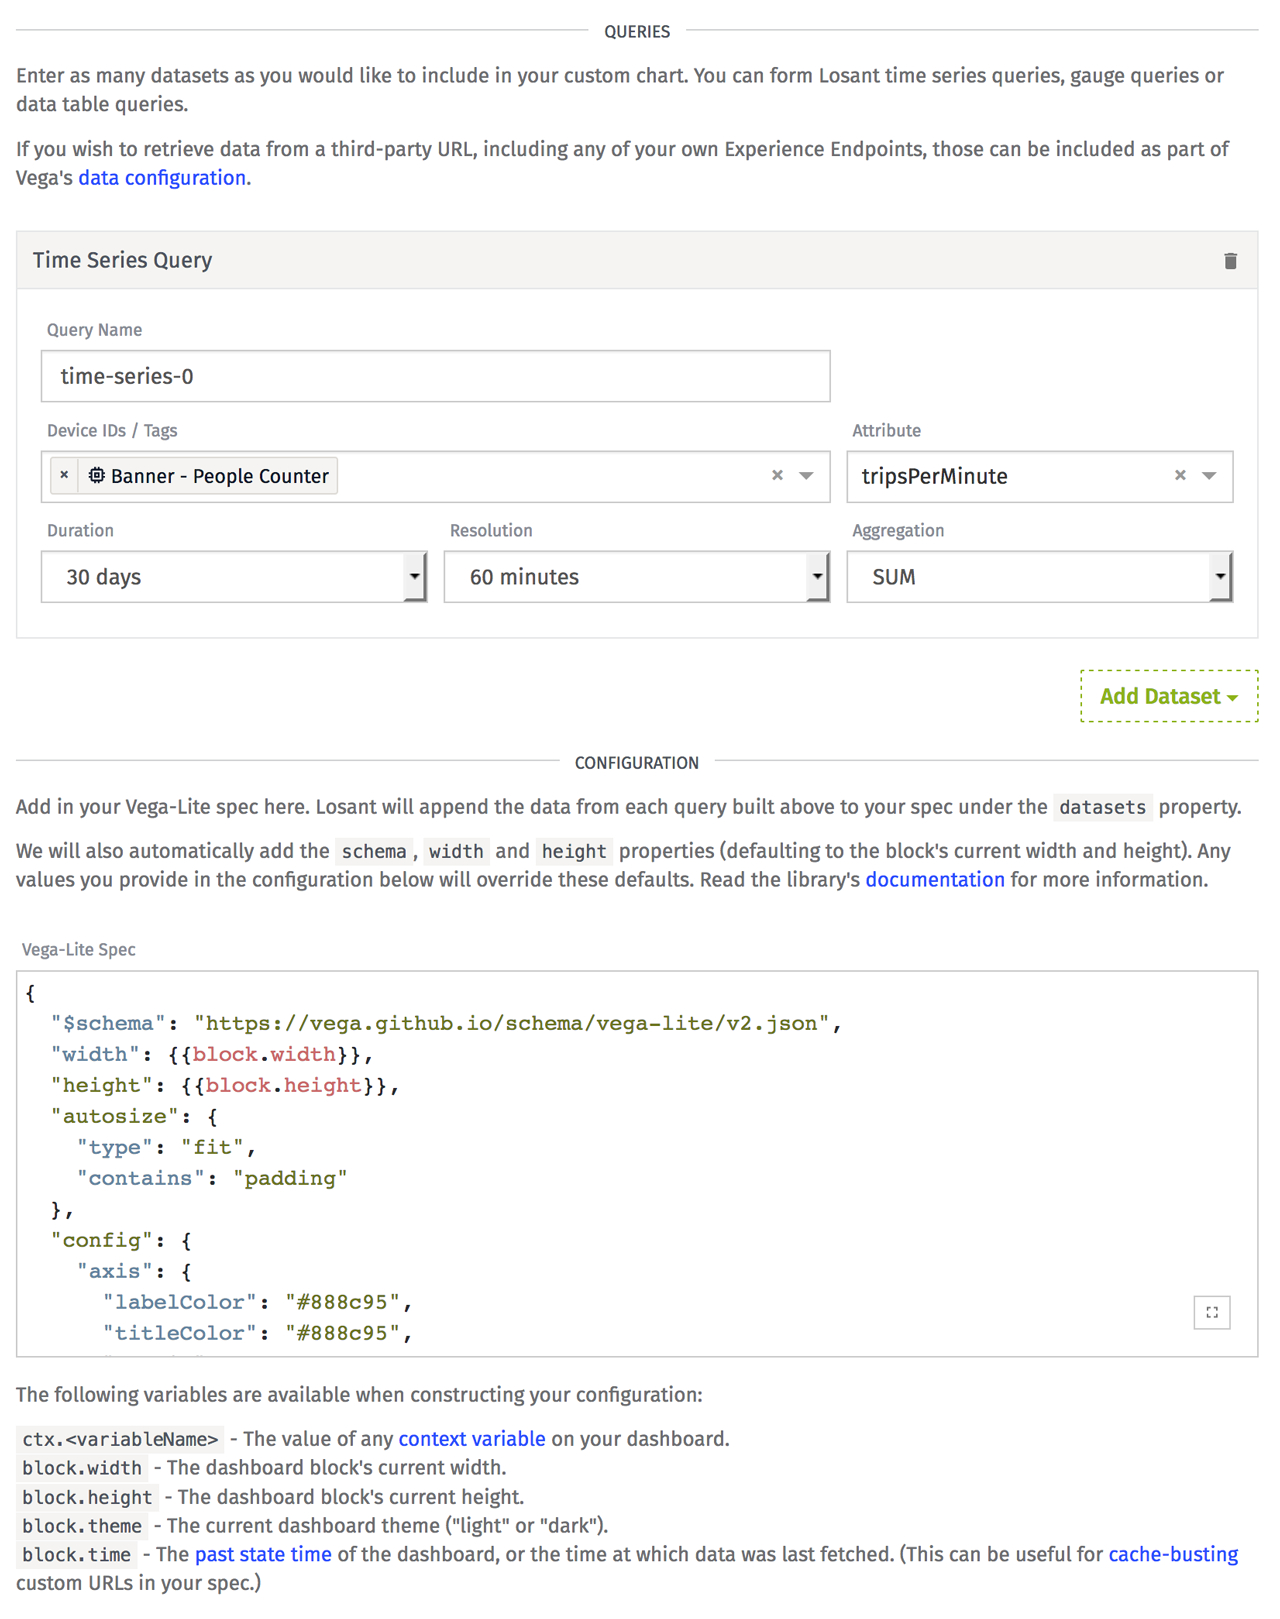
Vega-Lite provides a lot of capability when it comes to displaying your information. Refer to their examples and documentation for details. Here is the configuration that renders the example chart in the screenshot above:
Time Series Line Types and Gap Detection
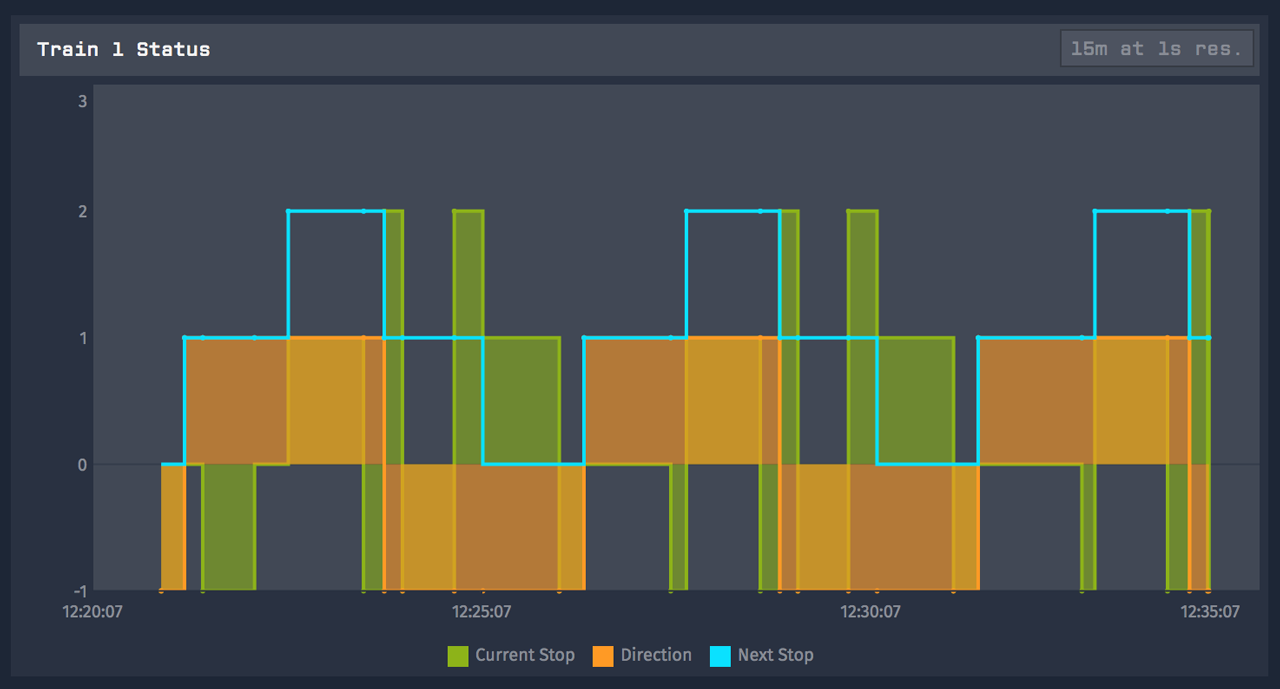
Along with the new Custom Chart Block, we've also added some new features to the built-in Time Series Graph Block. The first is the ability to change the line type between smooth, linear, and step. Below is an example using the new step line type.
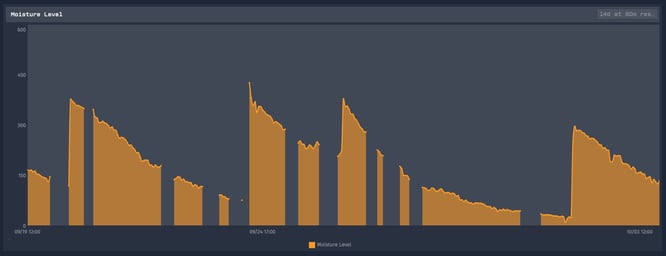
The feature is one that customers have been asking about for a while, which is the ability to automatically detect gaps in the data. Prior to this release, points on a time series graph were always connected, which could mask times when a device is offline or not reporting data. Below is an example that uses the new gap detection feature, which shows the times this particular device was offline.
GPS Resolution
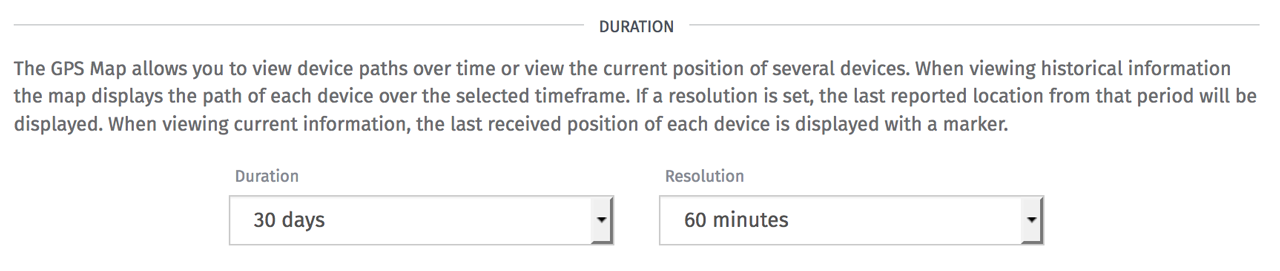
This release also adds a new resolution feature to the GPS History Block. This feature provides a way to downsample your GPS data, which can yield big performance improvements for your GPS maps. This is especially useful when viewing the history of a device or family of devices over a large time range. If you're viewing 30 days of history, seeing every data point is not particularly useful. The resolution feature allows you to sample the data on periodic intervals to reduce the total amount of information being displayed on the map.
Other Updates
- Added a new type of template format helper.
- Added the ability to concatenate arrays with the Array Node.
- Added the ability to execute processes in the background with the Run Executable Node.
- Added the ability to quickly delete all experience resources.
- Added the ability to draw polygon geofences in the Geofence Node.
What's Next?
With every new release, we really listen to your feedback. By combining your suggestions with our roadmap, we can continue to make the platform easy for you. Let us know what you think in the Losant Forums.