
Workflows are a core component of our IoT application enablement platform. Workflows provide a low-code and high-productivity environment that enables developers to quickly bring complex IoT solutions to market. As part of our ongoing goal to deliver the easiest and most developer-friendly platform possible, we wanted to provide greater visibility into the health and performance of your workflows.
Workflow Metrics
This update adds a new Metrics tab to the Workflow Editor. This tab provides high-level statistics about the usage and performance of your workflows, as well as a record of any critical errors thrown by your workflow runs.
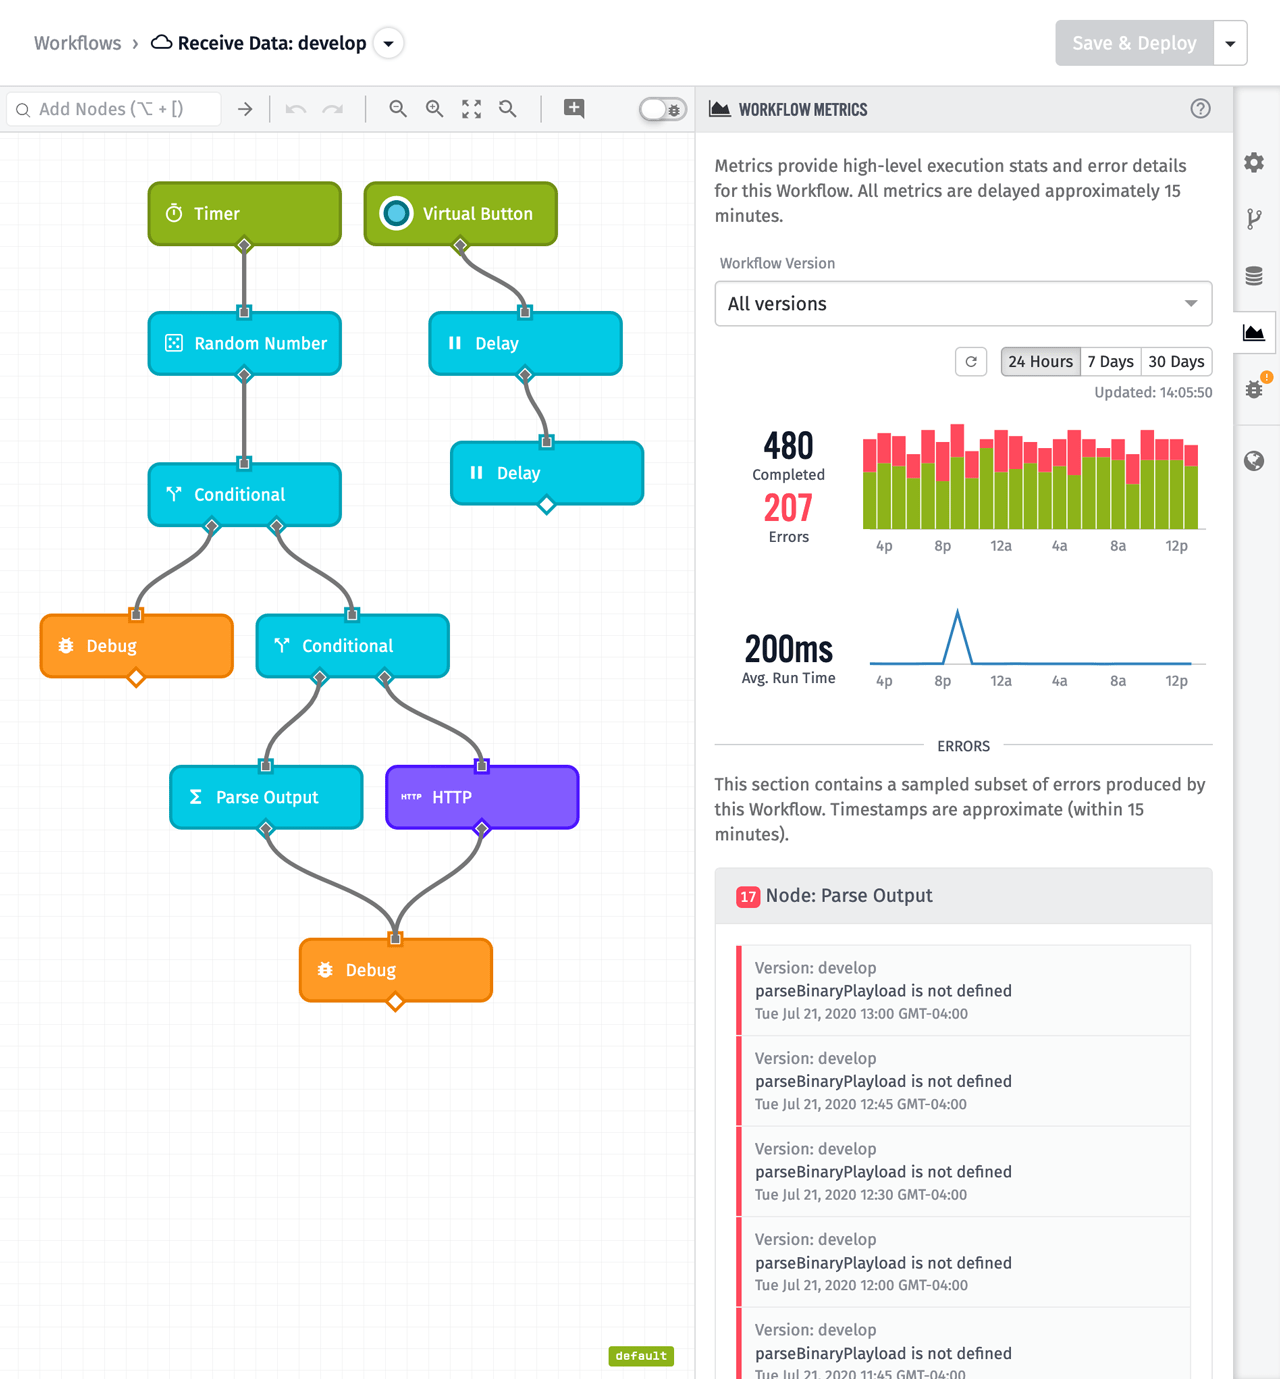
The metrics tab is divided into two sections. The top section contains Workflow Run Statistics, which provide insights into this workflow's execution counts and timing. This data is useful to understand how frequently your workflow is being triggered, or if it's being triggered at all. Workflows have a maximum execution time of 60 seconds, and in most cases you'll want to stay well under that to avoid timeouts. The timing data displays how long it takes your workflow to execute, so you can make informed implementation choices when optimizing execution times.
The bottom section contains Workflow Errors. It's impossible to account for every possible error during the initial development of your workflow, so having a place to gain visibility into new and unexpected errors is important. This section makes it easy to identify the source of errors so they can be addressed as part of the ongoing maintenance of a production application.
Dashboard Data Transformations
The units you choose for your device attributes (e.g. Celsius) are not always the same units you'd like to display to your users (e.g. Fahrenheit). To accommodate this difference, many dashboard blocks now support expressions, which allow you to transform your device's raw data before being displayed. These blocks include:
Expressions look and work like a mathematical formula. For example, if the device's raw data is in Celsius and you'd like to display it in Fahrenheit, the expression is ({{value}} * 9/5) + 32.
Another use case is to transform the result of a Time at Value aggregation. The Time at Value aggregation is useful when determining the availability of a piece of equipment. For example, you can use it to calculate the amount of time a "status" attribute was equal to "running". The result of the Time at Value aggregation is in milliseconds, and it's very common to display availability metrics in units of hours.
The screenshot below shows the raw result of a Time at Value aggregation over a 24-hour period:
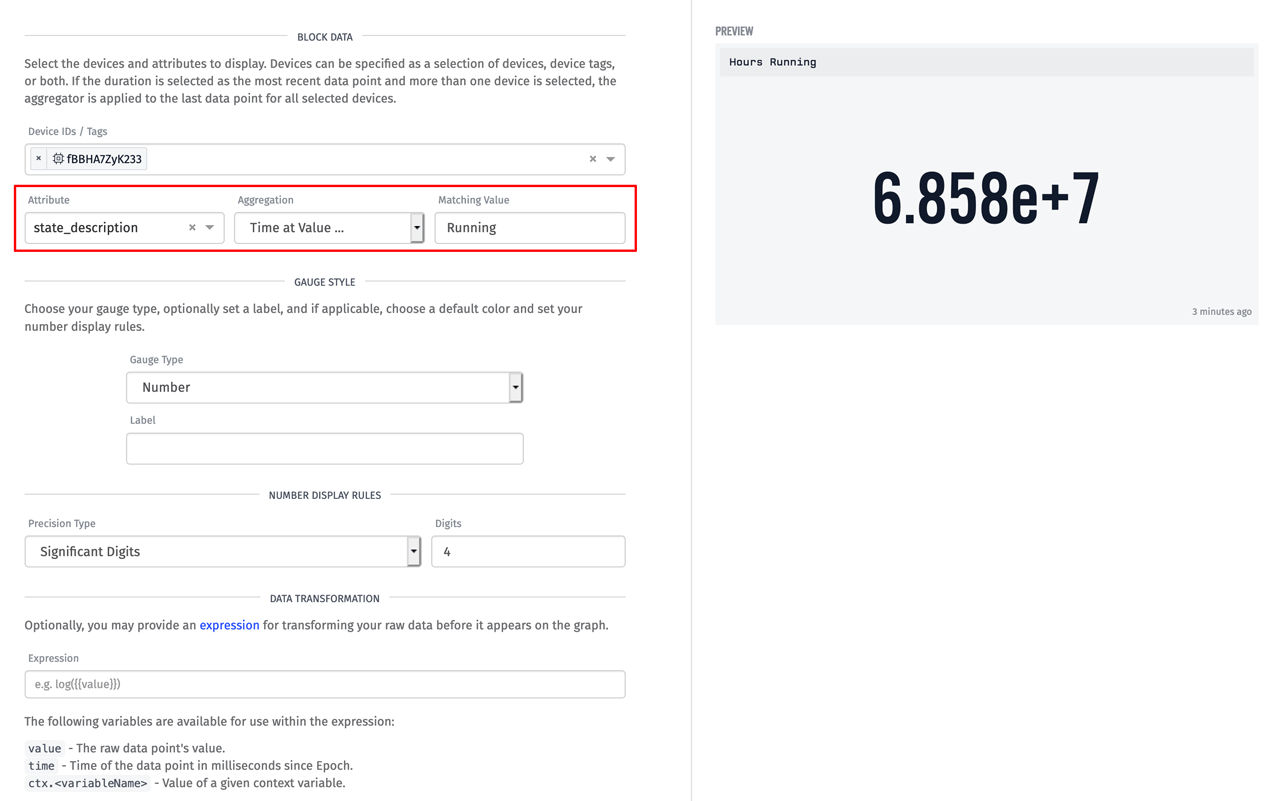
This result is in milliseconds and is not very easy to read. Hours would be a much better unit of measure for this specific use case. Milliseconds can be transformed into hours by adding a data transformation to this block:
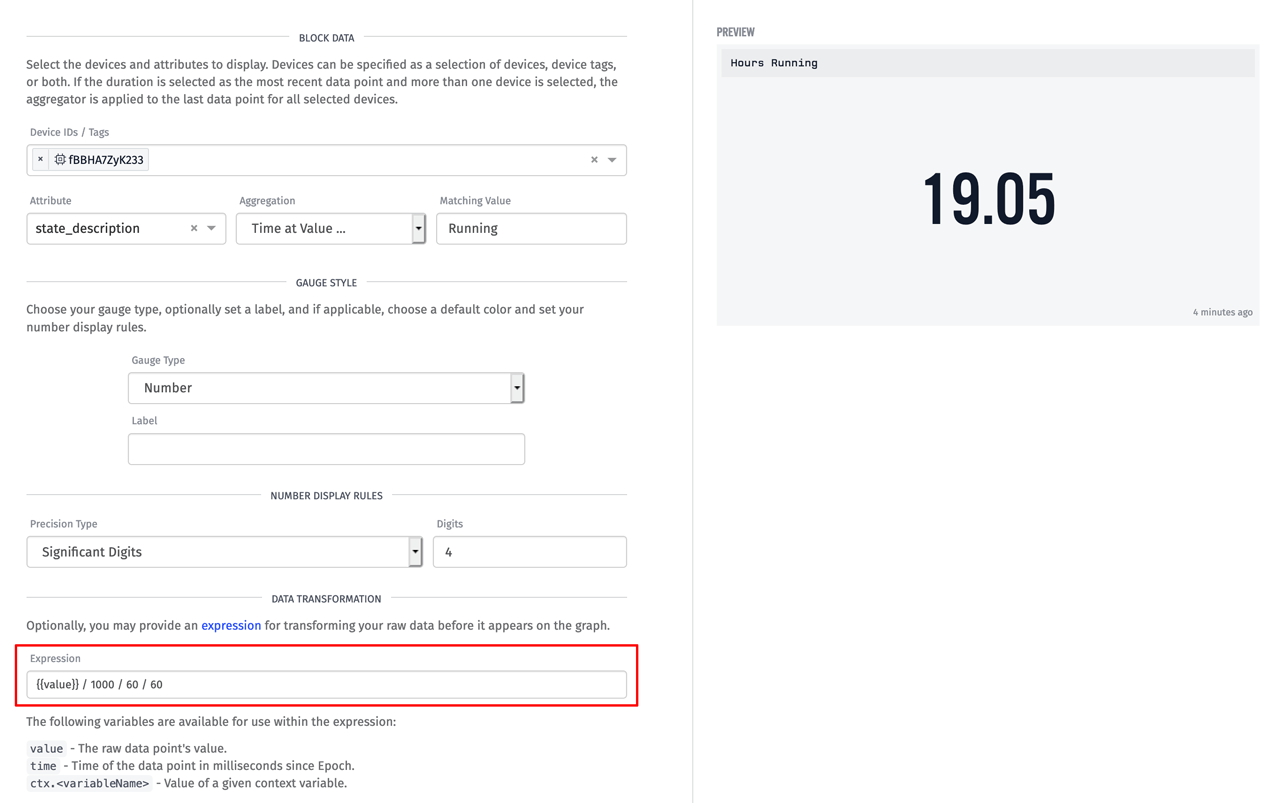
The expression for converting milliseconds to hours is the following:
{{value}} / 1000 / 60 / 60
With that expression applied, we can now see that over the last 24 hours this piece of equipment has been running for 19.05 hours.
Other Updates
- The Array Node now supports the Group By operation.
- The Device: Command Node now supports the Advanced Device Query.
- Experience Components now support Arguments.
- Notebook Inputs can now query Device Connection History.
- Added the queryStringEncode helper to easily convert objects into query string format.
What's Next?
With every new release, we listen to your feedback. By combining your suggestions with our roadmap, we can continue to improve the platform while maintaining its ease of use. Let us know what you think in the Losant Forums.