
You don't have to be on social media to see that the 2016 U.S. Presidential Election has become one of the most discussed and debated elections in history. However, taking a look at the candidates' and public's activity on social media has shown some interesting insights. A few weeks ago (when Bernie Sanders was still in the race) we built a Losant application to track and visualize real-time Twitter activity and sentiment for the three leading candidates.
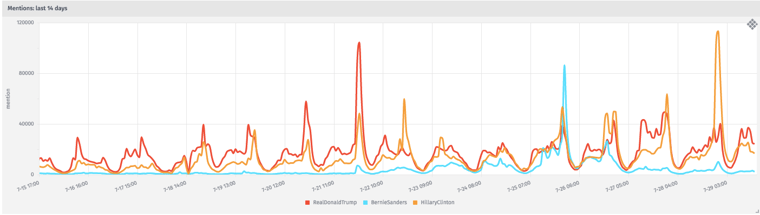
Though Losant works well with data from a variety of hardware and sensors, today we're going to focus on some of the features that allow you to work with any non-hardware data source that serves up real-time data, i.e. APIs and external data sources. Our Election Twitter Dashboard tracks the real-time Twitter activity for the handles of @RealDonaldTrump, @HillaryClinton, and @BernieSanders. Here's a look at the last two weeks, which have been highly eventful with the Republican National Convention taking place on July 18-21 and Democratic National Convention over July 25-28.
Tracking Mentions
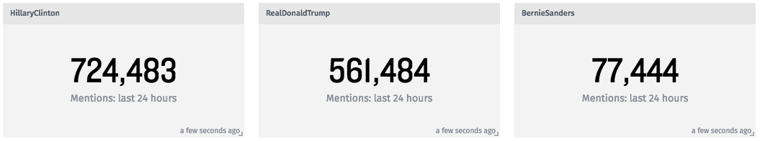
Tracking mentions is fairly simple. We are using the Twitter Streaming API. Here, it's interesting to see who is being talked about the most and when. We should point out that Trump has over 10 million followers compared to Clinton's nearly 8 million and Sanders' 3 million. For both Trump and Clinton, the top moments over the last two weeks were at the end of their respective conventions on July 21 and 28. Accordingly, Sanders' mentions peaked as he took the stage at the DNC on July 26.
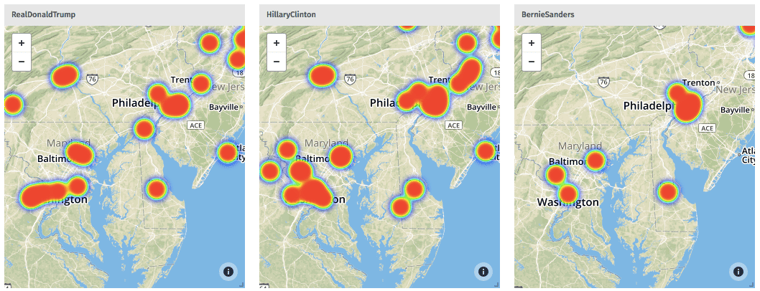
Tracking Location
Tweets that have geographical coordinates are also aggregated and displayed on the heatmaps. As you might expect, major metropolitan areas showed the highest volume. However there are some interesting differences as we zoom in on certain areas. Here's a example of Philadelphia / Baltimore / DC.
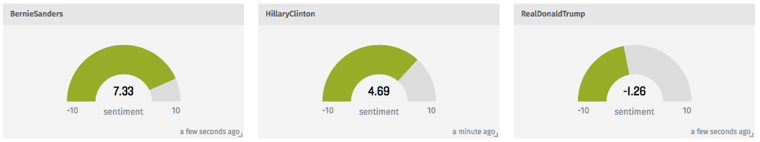
Tracking Sentiment
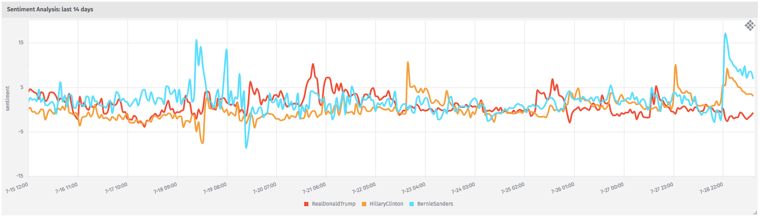
We use the Sentiment Node Module to perform sentiment analysis on all Tweets to provide a score between roughly -10 and 10. Again, none of the information we're presenting is an endorsement for any candidate. That said, Sanders' sentiment score is, on average, significantly higher than the other two candidates. Clinton's average score is a distant second, with Trump's average score a distant third.
Like mentions, it's interesting to look at when and whose sentiment was highest and lowest, as well as sentiment score relative to the other two. For example, we see a huge spike in Sanders' sentiment along with a huge dip in Clinton's on the evening of July 18 when news broke about the DNC stacking the deck against Sanders. As expected, Trump's and Clinton's sentiment score both peaked at the start and end of their respective conventions.
Candidate Tracker Workflows
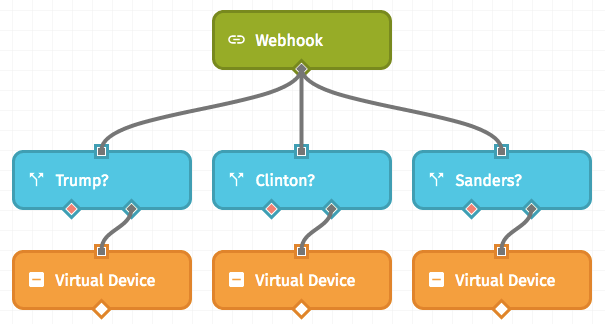
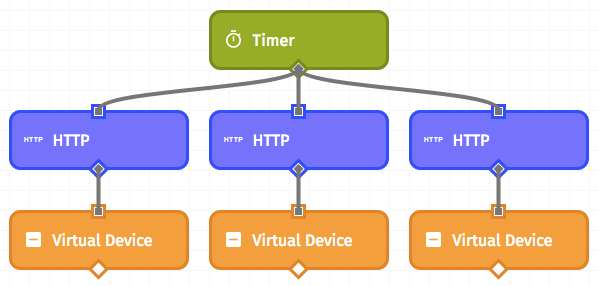
The workflows powering the application are fairly simple. Once a minute, three HTTP requests are made to the Twitter API to retrieve the number of followers for @RealDonaldTrump, @HillaryClinton, and @BernieSanders. Also, a webhook listens for requests containing a sentiment score and a location for each mention of one of the respective candidates, and an attribute is set on each candidate’s virtual device.
If you're interested in building an IoT project using real-time data that doesn't require hardware, another good option is our tutorial for building your own virtual weather station powered by Forecast.io API. We'd love to hear about any other projects you're working that take advantage of virtual devices and external data sources. Drop us a note in the comments below or in forums.losant.com.