


Brandon Cannaday: Hello, everybody. My name is Brandon Cannaday, and welcome to another Deeper Dive webinar. As the name implies, this gives us a chance to take a deep dive into some of the more technical areas of the Losant platform. Speaking today, it's going to be me, I'm going to be acting as kind of host and emcee getting us kicked off here. Once again, I'm Brandon Cannaday, I'm the Chief Product Officer here at Losant. The person doing the majority of the speaking is going to be Dylan Schuster. Dylan was one of our lead engineers for a long time, and now is our Director of Product for the platform itself. He's going to be taking us through a lot of implementation best practices when it comes to our workflow engine. One of the biggest benefits for joining us live versus catching a replay is that you do get to ask questions, so joining us for Q&A is Heath Blandford, one of our success engineers. If you've ever been in our forums or reached out to support, you've probably had a conversation with Heath. Over the years, he's become quite an expert in all things Losant. Speaking of Q&A, I want to direct everyone's attention to the bottom middle of the Zoom webinar software. You'll see a Q&A button. At any time during the webinar, feel free to click that button and put a question out there. We're going to do all the questions at the end, but don't hesitate at any moment if something pops in your head while Dylan is speaking, to go ahead and drop a question out there. If you aren't able to stick around for Q&A, don't worry about it. The webinar is recorded. We'll be sending that out to all the attendees. They're also available on our YouTube page, and you can find all of the previous recordings on our website, losant.com/deeper-dive, so you can check out this replay and replays for all our previous deeper dives there. If you happen to be new to Losant, I want to give a quick overview of what we are so that the rest of this webinar can make sense. We provide the edge and cloud software foundation on which our customers develop and bring to market their own IoT products and services. You can think of us like an IoT platform or an IoT application. We provide those building blocks on which applications are built. There's a lot of functionality in the Losant platform, but today's webinar is really going to focus on the visual workflow engine. That's our low code development environment to really provide the intelligence that backs all parts of your Losant application, so realtime stream processing, alerting, notifications, even those business rules that are required for a real application. If you want to get a demo of all of the rest of what Losant is, feel free to reach out, just go to losant.com, you'll find some contact forms there. We'd be more than happy to get you connected to one of our experts, and they can provide you a more thorough demo of all of the rest of Losant. We are one of the leaders in the IoT application enablement space, in the industrial smart environment, and telecommunication industries. We provide this foundation for some of the largest organizations, and we've got customers all over the world. We recognize that Losant, while it provides the software foundation, there's a lot of other technology that all has to come together in order to build one of those real, complete IoT products and services. So we surrounded ourselves with an excellent partner ecosystem which includes strategic partners who we kind of share business models and go to market strategies with. We've got solution partners, which actually help do the development work, if you want to kind of offload that outside of your own organization, and then technology partners which provide hardware, sensors, or even other software services that augment or extend what may not be provided by Losant out of the box. So if you are a potential partner and you want to look at working with Losant, or you're a solution developer or a customer looking for other parts of the technology stack, I really recommend you go check out losant.com/partners, browse our partner ecosystem, and see if there's something there that might solve a problem that you have. Today's webinar is going to be all about workflows, building performant workflows that scale with your IoT solution. Before I toss it over to Dylan, I want to provide a little bit of background about why we wanted to approach this topic. Losant at its core is really a technology that you use and develop on top of, and every technology has kind of wrong ways to use it and right ways to use it. This example here is kind of an analogy I wanted to use to compare Losant to another technology you might be familiar, and that's SQL databases. If you've ever had to scale a SQL database, you certainly understand some of the challenges that happen as you grow and grow and grow. If you made some decisions poorly early on, they'll come back and bite you later on. I've listed a couple the best practices here that you might be familiar with databases, properly configuring your indexes, using correct data types, avoiding SELECT * and using LIMIT, restrict the amount of data that you're querying. All these technologies have these best practices, where, even if you don't use them, what would work on a very small amount of data may start to break down you have a large amount of data. In a lot of ways, Losant works in the same way. What would work in your proof of concept phase with a very small amount of devices may start to have challenges when you scale it up into the millions of devices, and that's really what today's webinar is all about. Dylan's going to take us through some of these best practices so that you can kind of start your development with the right frame of mind, the right techniques, so that when you do grow these applications, the Losant platform will happily scale with it. At this point, I'm going to pass it over to Dylan. He's going to take us through the rest of this webinar. Dylan?
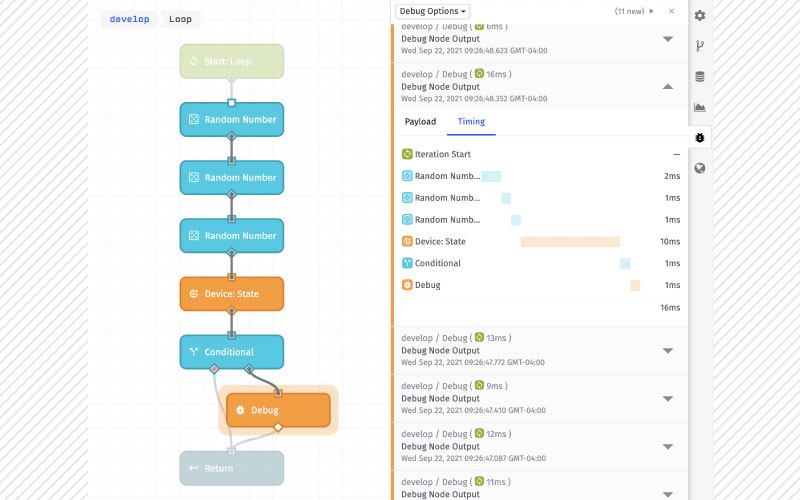
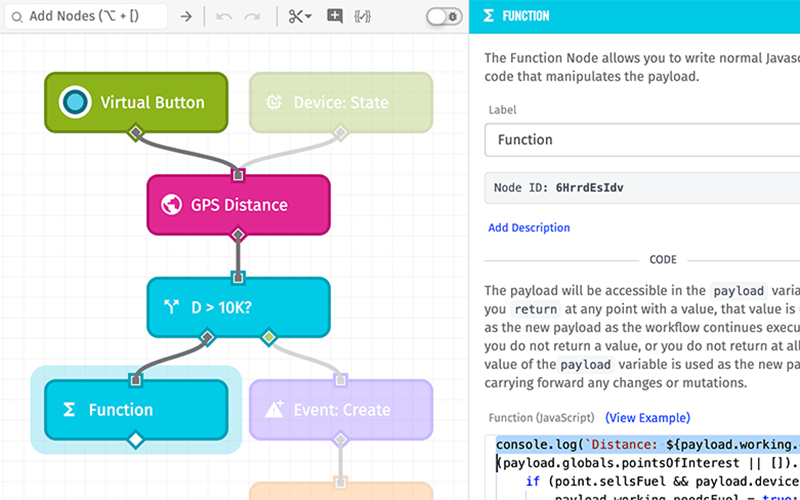
Dylan Schuster: Thanks a lot, Brandon, and thanks everybody for coming to this webinar today. You should be able to see my Chrome browser window right now. If you're here today or if you are watching the replay, you have what I call good problems. That means that you have built a product on top of Losant, and a lot of people are starting to use it. You have a lot of devices that are being registered, you've got a lot of experienced users making requests, and you are now reaching the point where you can start thinking about the performance of your application under increased load. It means kind of shifting your mindset away from developing features to get more and more people into your product, and more towards a maintenance and a performance development mindset. Again, a good problem to have. Sure, it can be stressful. Problems can arise from that kind of thing, but that's what we're going to talk about today, is how to make your workflows at least more performant and more resilient as you scale them up over time. We'll talk about performance and scalability generally, what they are, what they mean, and more specifically, where the line is drawn between Losant as a platform provider and you as an application developer on top of the platform. We'll talk about when it's time to think about performance and scalability as product developers. We'll spend most of our time on this right here, these quick wins for boosting performance inside of your workflows. We'll give you some really good tips for how to get the most performance out of your existing workflows. Finally, we'll end with just some general tips for addressing performance in live applications without disrupting your current functionality, without negatively impacting your existing users. So, start with some definitions. What do we mean when we talk about performance and scalability? Performance is a metric that is an indication of the responsiveness of a system to execute an action in a given time interval. That's a $50 way of saying, is it fast? That's what we mean we talk about performance. Is the application providing its intended outputs in a reasonable amount of time given its inputs? The way that applies to Losant and do you as application developers is simply, does my workflow return results fast enough for my use case? Secondary to that is scalability. I shouldn't say secondary, kind of parallel to that is scalability. Scalability is basically adding another dimension to performance, is that, do we continue to have performance, good performance, as we increase the load on the application? So, as we provide additional inputs, does our application continue to perform within our desired metrics? Most of what we're going to talk about today when it comes to working with Losant Workflow Engine, is going to focus a lot more on performance up here, because the way Losant is architected as a platform, a lot of the tricks that you would have at your disposal as a software developer to improve your scalability, load balancers, caching, horizontal scalability, in other words, if you were to clone a workload multiple times, those don't really apply in the Losant case. To put it frankly, that's what you're paying Losant to do. You are paying us, you're signing a contract that says "I'm going to throw 100,000 devices on your platform, and those 100,000 devices are going to generate 300,000,000 payloads per month," and that's Losant's problem, to make sure the MQTT broker can handle those devices, that we can write the time series data to our database, that you can query that data in a reasonable time, all of that. You're paying us to do that stuff for you so that you don't have to hire a DevOps engineer who's going to build out your entire infrastructure in a cloud environment and make sure that it scales horizontally, and that the load that's put on that can fluctuate over time and spikes. That's our problem. However, you still have, through the workflow engine in those cases, the responsibility to deliver results to your end users in a reasonable amount of time, thinking mostly about experienced users here making requests to your application, those being processed by workflows and returning the results in a reasonable amount of time. Users on the web are a fickle breed. They will bail if your workflows do not respond to their requests in a reasonable amount of time, so this is very important, keeping your performance of your workflows up, performing and returning results in a reasonable amount of time. These issues that we're talking about rarely show up early in development. These are the kind of things that show up as your application scales. If you're talking about an application that takes 5 milliseconds versus 50 milliseconds, for a 10x difference when you throw one input at it, well, that's a 10x difference, that's big, but at the same time, 5 versus 50, talking in milliseconds, really isn't that big of a deal. Now, take that and multiply it by 100, and then 1,000, and then you're going to start to see significant issues, where 500 milliseconds becomes 50 seconds at that point. That's the point where you're really going to start to see these performance and scalability issues come up, as your application scales up, so definitely keep that in mind. The tools of the trade here that we're going to be working with is the new feature that we released approximately a month ago, the Workflow Debug Timing tab. So the way this works is, any place you have a debug node in existing workflow, in addition to printing out the payload, which you're used to, that comes in the message over here, we are now also providing detailed timing information on all the nodes that preceded it, as in, how long did each of these nodes take to execute. In this example right here, here's the debug mode, which took practically no time at all, but the nodes that preceded it, a device get node, took 460ms, and the bulk of our time was used in this Loop Node right here, 3300ms. That adds up to the total time that we're now also displaying up here in the top of the message, to show, per workflow run, or I guess I should say per execution of a debug node, how much time did it take to get to that debug node. Before we released this feature, you could do this kind of analysis yourself, but it was pretty tedious. You'd have to sandwich various nodes with debug nodes on either side, take a look at the timestamp differences. So the introduction to this feature is why we decided to run this deeper dive now, because it makes it so much easier for you as the application developers to find those points in your application and your workflows where you're running into those timing issues. We're going to lean very heavily on this today. We're going to keep coming back to this Debug Timing tab. I do want to point out the difference between running a debug node outside of the loop, as you see right here, versus inside of a loop. When you are putting a debug node inside of a loop, the timing information that you're going to see over here on the right has to do with the iteration itself, so the timing, the 16ms that you see up here, that is applying from the beginning of this iteration all the way down to the debug node that you're seeing down here, and then all of the nodes along the way and how much time they took, as well as the percentage of that time leading up to the time you see up here. That's important to point out. Let's talk about when you should consider... We already mentioned that scalability and performance issues rarely show up early in development. I love this quote. I put this in the blog article also when we announced the Debug Timing feature. This comes from Kent Beck, who's a pretty well-respected member of the software development community, one of the signers of the Agile Manifesto. "Make it work, make it right, make it fast," and the order of those is what's most important here. Make it work, then make it right, and then make it fast. So what do we mean when we say that? Let's take an actual product launch for an example, and this probably applies to a number of you listening today. The make it work step is what we call the proof-of-concept, PoC. So I've got this temperature sensor sitting on my desk. Can I use Losant, and use a cellular connectivity provider to connect to Losant's cloud broker, publish state data to that cloud, and can I visualize that on a dashboard and send me a text message any time the temperature gets over, call it 85 degrees Celsius? So the PoC, this is nothing ready to release yet, you just want to see, is this the right tool for the job, can I make this work? That's the make it work step. Once you've decided that, yes, we have something here, we can work with this, then you go on to the next, make it right. This is what we call, in the agile software development community, MVP, minimum viable product, MVP, minimum viable product. That means the point at which you have enough of your product complete that you can start to monetize it. You've got enough features in there that people are willing to give you their money in exchange for the use of a product. So, number one, is it usable, does it have all the features that are necessary? Am I handling reasonable error cases? And you want to make sure that, before you spend your time on things like building a killer user registration flow, that you actually can work with this product, otherwise... So, for example, if you spend all of your energy building out a device registration flow as part of this MVP step but you eventually find out that this product is not going to work at all to go on top of, in other words, you didn't do your work to make it work in the proof of concept stage, this is all wasted effort at this point. That's why the order of these is important. Is it going to work? Now let's make it work, and then, finally, and this is what we're here to talk about today, then you make it fast. Now you have a mature product on your hands. Losant itself, you can say the same thing about our company's history. Before we spent a lot of effort making sure that we can handle 100,000,000 devices connected to our broker, we spent more time building data tables, notebooks, innovations, to make sure to broaden our base to bring more people into the product, and then as we start to scale up, that is when we're going to start spending time on the make it fast step. That is when we see those milestones coming and looking at our performance metrics and knowing that now is the time to spend making our product fast. This is, by the way, a classic pitfall of early software companies. We say they overengineered their solution. They spend 3x the amount of time getting their initial product out to market because they're building it to scale to where they expect it to be in 5 years. They're spending so much time in the make it fast step that they delayed getting the product out, and potentially wasted effort building up for the scalability issues before they even had those scalability problems on hand. That is to answer the question of, when is it time to think about performance and scalability? You should always keep it in the back of your head, of course, but I'm not going to tell you to drop everything and start worrying about these problems right now. You need to see them coming and you need to resolve them before they actually manifest and you have your end users actually running into them, but don't do it too soon. Make sure that you of an actual product you can monetize first. With that, let's talk a little bit about some good tips for building performant workflows inside of Losant. I've got a few of these prepared for you today with some use cases that we're going to run through. The first one were going to talk about is the Function Node. If you are an experienced software developer, and I know some of you on the call today are, you probably gravitate towards the Function Node, especially if you are a JavaScript developer. It is just human nature to first gravitate towards the tool that you know versus the tool that may necessarily be right for the job, because you have to spend that much less time getting up to speed on it. There are pros to a Function Node. We typically try to steer people away from them, because for non-developers, they're going to find a lot of the similar logic nodes in here that can be accomplished with a Function Node, like an array, the object node, string node, all these down here. For a non-developer, it's going to be a lot more intuitive to fill out these inputs and get the output that you're wanting than it is to actually write JavaScript. That said, there are benefits of the Function Node. The code that executes inside of a function is extremely quick. Once you're inside of the function, it's extremely quick. The downside to the Function Node, which I have over here, is that there comes with running one a fixed time cost. If you just think about what a Function Node is for a minute, Losant is allowing our end users to write arbitrary code and execute that code inside of our private environment. That's a pretty big security lift. So, in order to accommodate that, to make sure that nobody is running amok, potentially crashing our infrastructure or getting into other people's data, we have to really wall this off and sandbox it. So, before each and every Function Node runs, there's a step here where we are creating that sandbox environment, we are serializing the payload, passing it in, then we are actually executing the Function Node. Again, that step's really quick, but then once we're done with the execution, we then need to tear it down. Then we can move on with the rest of our workflow run. There's costs there. No matter how quick this goes, you're going to spend time here before, and you're going to spend time after for using a Function Node. In addition to that, we don't see it very often, admittedly, but there is a per-app concurrency limit on Function Nodes. What I mean by that is that, per application, we only allow a certain number of Function Nodes to be executing in any given one time. So if you are using Function Nodes very heavily, you may have other workflows in your application that are waiting for their turn to execute their Function Nodes, so you could be potentially causing performance issues elsewhere in your application just from one workflow that's making heavy use of the Function Node. Let's actually run through this test case right here. In all four of these stacks, we're doing the same thing. We're running 1,000 iterations, we're going to just generate some random numbers, push them into an array inside of the iteration, so this is the Native node case right here. We're going to generate three numbers, we're going to push them to an array. What you see right here, this is just so that we can log out every hundredth message. This is a neat little trick if you're trying to log the contents of a loop and you've got a lot of iterations, because without this here, if we just logged every time, we'd really bomb our debug tab out with a whole lot of messages that wouldn't be very useful. By the time we're done with that, we'll take that resulting array, we'll flatten it so that array of arrays becomes a single array that's one level deep. We will sort those numbers, and then we'll return the results here via our debug node. Start with the case where we're only using the Native nodes. I run this here and these are the individual iterations that you're seeing here, again every 100th one. Pretty quick, 3-5ms each, and then the entire result of return is about 800ms. You'll see a little bit of deviation, so when you're doing your own scalability testing, you can see this one's a little bit slower. Probably don't just press the button once and then walk away, you want to test it a few different times. So using just Native nodes, all that work took about 956ms on that second one there. Let's test the same thing, but instead of all of these nodes, let's instead this time use a Function Node. This Function Node is doing all the same work that was in all those other nodes that we saw before. We're generating random numbers, we're pushing them to an array, and here we got our destination again to show every individual iteration. If I run that, you can see, taking a little bit longer per iteration, in the range of 15-40ms, and this took almost 5 seconds to get through and generate the same amount of data using a Function Node. Now, you may be asking, well, you said a Function Node is quick. Remember, we've got that setup for every single time. So 1,000 times, we had to create an environment and we had to tear down an environment for that Function Node to execute inside of. Again, if we had other workflows running at the same time, they may have been waiting their turn to execute their own Function Nodes. You see the time difference right there, 4700ms versus like 900, that's a 5x difference using the Native nodes in this particular case versus a Function Node inside a loop. This is one of the things that I want to make sure everybody comes away from this deeper dive with. Do not use Function Nodes inside of a loop if you can avoid it. It will slow down your loop dramatically, and it can lead to performance issues elsewhere in your application. This is one of the main takeaways of today's deeper dive. I'll say it again. Do not use a Function Node inside of a loop if you have any control over that. Now, let's compare the Native nodes case, which was about 900ms, to just doing all the work inside of a single Function Node. Inside of here, we're doing a loop. Inside of the loop, we're generating our numbers, we're putting them to an array, and we're returning a result. We're also doing the flattening and the sorting inside of here, and you're going to see that is lightning quick, 33 ms. So, yeah, a Function Node is very quick, you just want to use them judiciously. You don't want to stack them all up in a row like I'm doing right here. This is something I've seen real users do also, where I guess they're doing it because it's easier to think about the encapsulation of individual functions, but if I were to click this here, this is still going to be quicker than our Native nodes case. Natives was about 960ms, this is about 170, but we're doing that additional setup and tear down here and here and here and here, that's all those additional fixed times that we have to use a Function Node, so consolidate them if at all possible, which in most cases it should be. Again, it's an entirely different environment every single time you're setting it up or tearing it down. Function Node can be quick. It's not necessarily always the quickest option, though. You're going to want to test these kind of things on your own. This is a general rule, that one Function Node is going to run quicker than a loop of multiple nodes or a string of five or six Native nodes, but it's not always going to be the case. I'll just demonstrate that right here. In this case, we're going to fetch 1,000 devices in our application, and then we're going to group them the value of a tag. There's like 100 with a model of ABC and 100 with a model of DEF, and we're going to group those all together, so these are both going to return the same result. I'm going to push this button right here. When we take a look at our Timing tab, so this is running these two in parallel right here... The fact that we are using the same device get node, if I pop upon the Timing tab, you're going to see that's the same in both cases. If I were to only look at this number right here, hopefully you guys can see these boxes I'm drawing. This 996ms and this 1371, that's not that big of a difference between the array group by operation and the Function Node, but if you consider that 965 of that was just fetching the devices, the array node did that grouping in 5ms, the Function Node did it in 400, so that's a difference of like 80x. Definitely do your own testing in your own scenarios. In a lot of cases, the Function Node will be quicker. In some cases, the Native nodes will be quicker. But please don't ever use a Function Node inside of a loop. Okay, let's move on to our next case. Serial versus parallel loops. We introduced parallel loop execution, I think it was about six months ago at this point. It used to be that all loops would only run serial mode. What I mean by "serial" is that one iteration runs one after the other after the other, so we go through a loop, we do the first one, then we do the second one, then we do the third, and so on. In the case of a parallel loop, we can run up to five of those iterations all at the same time in parallel. You can just see the difference right here. If you imagine time going from top to bottom here, it's a no-brainer that of course a parallel loop is going to run faster. We have more computing power, we are taking advantage of the event loop, and filling all that space that'd normally be waiting for executions to complete with another execution. Parallel is pretty much always going to be faster. There are advantages to using a serial loop. Number one is that you can actually mutate the payload from one iteration to the next. If you needed to set some sort of variable in your payload right here, then you wanted to reference it here and then here and possibly change it, that is not something you can do in a parallel loop, because this variable may not be set by the time this one executes or even finishes, because they're all running in parallel. So, no mutations to the payload across runs. The other advantage would be in the case of a serial loop, you do have the option of breaking out early. Let's say you're iterating 1,000 times, and by the time you hit the 10th iteration, you already know that you're done. You've found whatever it was you're looking for. You can bail out in a serial loop and not do those remaining 990. You cannot do that in a parallel loop. If that is your use case, I would at least explore the parallel option to see if you could adjust your workflow in a way to take advantage of parallel... It's going to depend on how likely you think it is for the break to occur and where in the stack of items you're iterating over it's going to occur, but it's at least worth a look because there's significant performance improvements to do your loops in parallel. Let's demonstrate that. In this case, we're going to fetch the first 100 devices in our application, and we're going to sort them by name. Then, for each of those devices, we're going to generate a random number. We're going to use that random number as a seed that we're going to pass to a third-party service—this is actually picsum.photos, it's a free stock photo service—to get a random image back. When we get that image back, we're going to save it as a BLOB attribute on our device. Here's our destination, again, to log out every 100th. The only difference between these two, you see inside of here, it's all the same thing, is that this one's running in serial, so one after the other, and this one's going to run in parallel. Let's compare the two. Starting off with serial, and you can see we're logging every 100th, it's coming around 270-280 per iteration. At this rate I would guess it's probably going to take about 30 seconds to get through all of them. Again, it's making a request to that third-party service, and then by the time this one finishes... This one's going to finish, and then it's going to start the next, and then it's going to start the next. That's what you're seeing here, is those requests stacking up and taking time. You are at the mercy of the third-party service in these cases, so bear that in mind. They may typically reply in 200ms, but you see a couple down here that got a lot slower. They could be rate-limiting, they could be having their own server issues, so just bear in mind that your workflows also should be built with resiliency for these third-party requests failing. You see it finally finished, it took about 41 seconds to get through all 1,000 devices. Let's do the same thing in parallel. You're going to see that the time per execution is about the same, in the 250-500 range right here, but it finished so much faster. We finished in 6 seconds, compared to 40. That was almost a 7x difference right there, because all the time that we're waiting for that third party service to come back with a response, we can be doing other work, we can be starting another execution of the workflow. So, if your use case allows it, this is a huge win, to switch your workflows from serial mode to parallel mode. I recommend you go in and do it. I know a lot of people still haven't. I'm guessing it's just because, like I said, we introduced parallel mode about six months ago and a lot of people probably built these workflows utilizing loops before that time, and if it ain't broke, don't fix it. But once you come up to start thinking about these performance issues, this is to be a quick win for you if you're utilizing loops. We saw a huge difference there talking to a third party service. Again, the third party services, if you're using those in a loop, that's where you're going to see those huge gains, these AWS nodes up here, this Azure Function Node, these Google Cloud nodes, HTTP, a lot of those. That's where you're going to see the big differences, because that's when we're waiting. When we're making up ground in the loop is when we're waiting for some other process to finish. In the case over here, we are going to stay within the confines of the Losant private network. We're going to run 1,000 iterations, and then for each iteration we're just going to return a single device. The first thing we'll do, and I'm just going to pop this open, we're going to use the device get node here. I removed our destination, I think we've got the point for this one. So we're going to use the device get node, which is a first-class node for fetching a device, over here. We're going to run that in serial. Let me clear this. And we're also going to run it in parallel. Same thing, device get. Let's go ahead and fire them both off, and again we're only going to get the final result this time. The serial node took 2790, parallel 2130. Now, parallel's still faster, but not nearly the huge results that you saw previously, and the reason is, like I said, where parallel's going to pull away is when the serial loop is waiting for something to come back, and when you're inside of Losant without having to go out to the Internet at large, you're going to see much less downtime, because we can talk directly to our database store, we can talk to all these resources to create, read, and that kind of thing, and there's very little downtime between those steps, so not nearly the performance gains you're going to see here, but still better. Now let's compare that parallel number, this 21, and we'll do the same thing, except this time, instead of using a first-class device get node, we're going to use a Losant API node, with the same call, fetching the same devices in the same way. We're also going to compare that to an HTTP node that is using the Losant API to do the exact same thing. I'm going to just fire both of those off right here. Again, this one's doing a Losant API node. We're comparing to this number right here, which is a Native device get node, and then the HTTP node, which is essentially doing the same thing as a Losant API, it's making an actual API request. You can see it still hasn't come back. It's 13 seconds for the API, and pretty close. Actually, the HTTP node is faster. This is because the Losant API node is making an actual API request, so it's leaving the workflow engine, so to speak, making requests through Losant's API layer, it needs to go back through the API and back all the way through to get that data back out. The takeaway here is that, in almost all cases, the Losant API node will be slower than the Native nodes that you see over here, sometimes dramatically. Sometimes you won't see it on a single iteration, which is why you want to kind of test at scale, that's why I'm doing 1,000 here. If I were to do just one, there's a good chance the Losant API node on any given one iteration would come back quicker than the device get, but in summation it's always going to be faster to use the Native nodes over here. That's why we keep adding these Native nodes over here. You can use the Losant API to do any of these things, but these are, number one, quicker, and, number two, for users who don't have a development background, they're going to find it a lot more intuitive to fill out these forms to get the database seed versus building the request object. That's going to be more so in the case of creating and updating resources than fetching ones. Let's go to our next case, spinning off heavy processes. You can also call this running processes in parallel. To compare two cases here, we see this a lot where users have a device state trigger that of course is triggered when a state report comes in and they're running this process, Process A, which we'll call a pretty heavy process, and after that they're going to run B, and after that they're going to run C, and then D. The problem is, if these take a very long time to finish, the ones at the bottom may never actually complete because there is a 60-second timeout limit on workflow runs. So how can we get around that? I think there's a misconception that workflow execution is what counts as a billable payload, which is why we see so many people consolidating everything under a single device state trigger. That's not true. The billable payload is the state report itself coming in. It doesn't matter how many workflows you trigger off of that, you're paying for the one state report coming in. So, we could break up these process... Assuming that the value of B does not depend on the return value of A, these are just independent processes, we can break this up in a number of ways. This state report can trigger two completely separate device state triggers. They can be in the same workflow or they could be in separate workflows. Off of any given device state trigger, you can run two parallel paths that come both out of same trigger node. Also, if you're going to loop over these and you need to do a process for each one that's pretty heavy, you can kick those to another workflow run using the workflow trigger node. I'll show you that one in a second here. So instead of needing 60 seconds to get through all of this, you instead get 60 seconds to run this, and 60 seconds to run this, and 60 seconds to run this, and then for each of those executions inside of here, 60 seconds to run one of those. That's going to be the big scalability tip. Almost everything we've talked about so far has to do with performance, which can lead to improved scalability by improving performance. This is the closest thing you're going to see to a scalability tip as far as building inside of the Losant Workflow Engine, is to separate these processes out into individual services. Let's take a look at that. Let's say, same thing, we're going to fetch 1,000 devices, and we've got to do some kind of work on each and every device. I'm going to kick this off right now, because it's going to take so long it's going to time out. Let's say at this point we've thrown every performance trick in the book at it. We switched our loops to run in parallel, we've taken our Function Nodes out, we've limited to only the data we need in the call. Inside of here what we're doing is we're fetching 1,000 devices. For each of these, we're going to run a Lambda function. We're going to call this a pretty heavy Lambda function, this actually takes about 500ms, 600ms to run, you can see over here, ever 100th one coming in. Then based on the value that comes back from that Lambda function, we may want to create an event. After that, once we're all done, let's also request a device data export for all data for these devices inside of want dial [Phonetic 00:39:48] for the current month. This is still going over here, and it looks like we're somewhere in the 400s as far as iterations go. It's going to time out in a second here. We just don't have enough time to actually complete it. There it goes. And you're seeing multiple timeout errors, by the way, because each of those parallel iterations is sending a timeout. That's why you're seeing five or six of them show up over here. As a result, I never got my data export. It never got to this point. It never executed that. What can we do differently? Well, the data export is completely independent of what we're doing up here, so let's just spin that off as a parallel process right here, number one. Number two, even if I do that, I'm still going to run into my timeout issues with the Lambda node as demonstrated here. What can we do? Well, we can, inside of the loop...actually, this is a dirty trick, but we've recommended it to people in the forums before, I've used it personally. We call this ping-ponging virtual buttons. That's why you see these four buttons over here, and I'll get to why. Inside of the loop... The virtual button comes with a rate limit, I think it's 10 presses per second. That is how the workflow-to-workflow node, which is this guy down here, that's how that works. You select a workflow, you select a version, you select a virtual button, you pass a payload into it, and it's going to actually execute that as a new process. The problem is that 10 per second limit, you're going to run into that if you are pressing one virtual button that many times inside of a loop. The way around that is to just basically connect, I have four up here, four virtual buttons, all going into the same process. Once they get here, it's all the same thing, and instead, I'm using a switch node up here, using the modulo operator inside an expression to say, okay, if I divide my index by 4, if I have a zero remainder, let's press 1, if there's a 1, press 2, if there's a 2, press 3, if there's a 3, press 4. It's like a load balancer, basically, except instead of distributing the load, it's getting around Losant's throttle limit on the virtual button. Let's try that. Let's press this here. I'm going to pause this, because it's going to start to get a little out of hand. There's my process to get my data export, there it went. You see—let me unpause it now—the individual iterations getting keyed up, and then you can see over here, this was index 600, this was index 700. It's kicking each of these off as an individual flow, so in addition to avoiding the timeout limit, it's actually boosting your performance because these are all getting done a lot faster also. So that's pretty neat trick, the ping-ponging virtual buttons and spinning off to another process, that's a good way of getting around this timeout limit if your use case allows for that breaking it up. I've got a few other quick ones I'll go through really quickly here, since I want to make sure we have time for Q&A. You can cache responses from third-party services using workflow storage. If you're going to make the same request over and over again inside of a workflow and you get the same result, instead of going out to the third party service or the Losant API and making that request over and over again, we can return it from workflow storage instead. What I did here is that I did not have that cache in storage, and if I check my storage container now, this is a key that corresponds to the request I made, the time, and all that kind of stuff. I can make the request a second time, and look at the difference, 80 seconds time and look request and 17, 16... This one over here, which actually just ran, this is responsible for clearing out that storage on a regular basis, because otherwise our workflow storage would start to overflow at some point if we never did actually clear it out. Now, this is a neat trick. It's probably better to bill it as a trick to get around API rate limiting. If you're using a third-party service and paying for 50,000 requests a month, this is a way of making sure you don't actually make 50,000 requests a month. But there is a performance gain that you can see right here also. Just to run it again, because our storage got cleared, 75ms there, and on subsequent requests, 5-10x faster because it's pulling the value from storage instead. Composite state, this is a big one I see a lot. In both cases here, we're going to fetch 1,000 devices, except in one case we do not need composite state. Composite state means the most recent attribute values for each and every device. You can limit it to all attributes or only the following attributes. I'm going to compare the two here. Fetching 1,000 devices without and with composite state. Fetching composite state is going to take significantly longer because we need to go look that information up. We need to go get that information out of our time series database and append it to the object that we're returning. You can see that was a difference of 3x or so. The takeaway here would be, don't request composite state unless you actually need it, because it is going to have performance impact on your applications. Then, finally, this is a good one, too, retrieving the total count of a query. Let's say you don't actually need the items in the query, you just need to know how many actually match it. You could compare that by fetching all your items and then counting them, that's what we're doing here, or you can use this neat little option we added to all of these first-class nodes over here. Instead of actually returning just the items as an array, you can return an object with metadata about the query, and that's going to include how many items matched your query. So you see I'm actually fetching zero per page. I don't care about the items, I just care about how many of them are returned. If I run this, 5ms to tell me how many match my query, versus 500 and something. That's 100x difference right there. Do it again, same thing. Actually, even better that time. So that's a neat little trick also to return numbers that match the query. One last thing here we'll talk about is just some general tips for developing performance improvements. Use that Timing tab. We used it very heavily today to compare one method versus another of getting the same result. We put that in there so that it would make it that much easier for our users to identify these problems inside of their workflows. It's a really cool feature. I've already used it heavily myself, not even just preparing for this deeper dive, but just for other work I've done inside of Losant. Please use it. It's a great tool for identifying these issues. Version your workflows. We don't see nearly enough people doing this in application workflows. Just to show you as an example, this workflow right here is responsible for generating states of 1,000 devices just for demonstration purposes, but let's say instead of generating these random numbers inside of here, I thought, I wonder if it would be any faster to generate my random numbers in a Function Node outside of it? Well, I don't want to break my current implementation, so what do is, I can create a workflow version, let's call it 1.0.0, let's also make it the default version, and now I'm currently looking at 1.0, if I go back to develop, you see this Timer's kind of hashed out? That's to indicate to me that this Timer is not actually firing right now. Instead, the one in my default version is. This allows me then to keep my existing functionality in place, but start to experiment up here. I could bring in my Function Node. I'm going to do it all, but then I'd want to delete these nodes in here, probably replace the device state node with something like a mutate node just to simulate it, because I don't want to actually record it. But this gives me a playground for making these kind of changes without disrupting my existing functionality. What's also nice about it is, let's say if I decided this is what I want to do, I can version that, call it 1.0.1, and make that the default version, and I still have 1.0.0 hanging around. If I found out in 10 seconds, oh my gosh, I didn't think about such and such, I can always roll back to 1.0 very quickly. So, please make use of workflow versions. It's a great tool for managing a production application, not just for performance issues, but also for changes in functionality. I talked about the role of tens. You don't have to overengineer your solution early, but definitely keep it in mind, and pay attention to when that's coming up. At the same time, listen to your developers. If you go to your developers and say, "Huzzah, we just signed a contract with the such-and-such government, they're going to give us 10,000 devices," and your developers panic, listen to them. Let them spend the time on the performance and scalability issues that they want to spend time on, because you do not want to fight those fires when they come up. You do not want your users to be the ones to tell you that you're having performance issues. Definitely spend the time on this, but make sure you have a good reason to spend the time on it first, and get ahead of it. You saw me today using virtual buttons to simulate scale. You can do the same thing. You can run a certain number of iterations. You can pass in the starting payload. You got a lot of options there for doing that. Monitoring workflow timeout, I didn't touch on this, actually. Let me go back to the develop version here. Actually, let me go into one of the other workflows. We'll say as an example, this will be the one where you probably want to use it to pick up timeout errors. You can use the workflow error trigger right here, that, if I hit a timeout error, that timeout error is then in turn going to fire this workflow error trigger. What I can do is say, send an email to myself that says "My workflow errored" with the details of the error so that you are finding out about these issues before somebody else is telling you about them. The workflow error trigger is a great monitoring tool, not just for timeout issues, but any kind of issues that would pause the execution of your workflow in a production environment. Finally, consider the usability if your performance can't be met for a user story. What I mean by this is, we had a user in the forums a couple weeks ago who was asking, "Why can't I built a time series dashboard block for 30 days of duration with 1 minute of resolution," something like that. If you've ever built the time series graph in Losant, you know that as you change the duration, certain resolutions appear and disappear. The reason is, number one, web browsers can only handle so much at a time. If you start throwing more than a thousand points at one of these graphs, your web browser is going to start to chug. It's going to have performance issues on the client side. Number two, when you're thinking about that much data, there may not even be that many pixels left to right on your screen to actually display one per point, and finally it's just the way humans consume information, that's probably too much to throw at one person. They'd rather want to see something more aggregated and then drill in to a smaller duration and a smaller resolution if they see something that they wanted to touch on. So, consider use case. If the platform is taking a significant amount of time to respond to your requests, there's a pretty good chance that your users would also suffer trying to consume that information. Losant, again, we're a platform, you're paying us to think about these things. We are providing those resolutions per duration because we've seen these problems and we've addressed these problems already, and hopefully you can take that same knowledge and apply it to your use cases with your end users. So, that's all I have. I see we have some questions lined up already. That's good. I'll stop talking for a minute, turn it back over to Brandon for some housekeeping, then we'll get into Q&A. Brandon?
Brandon Cannaday: Awesome. Thank you, Dylan. Yep, we've got some questions, but while I finish up here, please once again, if anything popped in your head, there is that Q&A button along the bottom edge of the Zoom webinar software, so feel free to pop that open and ask us some questions. Okay, before we get into Q&A, I got a little bit of final housekeeping to do. The first is a save the date. We're going to be doing another one of these deeper dive webinars with a technology partner called EnOcean. If you've never heard of EnOcean, I like to think of them as kind of magic sensors. They use energy harvesting, so really a lot of their sensors, all of their sensors maybe, don't require any batteries. They kind of use the energy in the environment. So you can think about maybe a smart light switch, the energy that is obtained by a human going pushing the switch in actually generates enough electricity for it to kind of send a little BLE advertisement packet. They use a lot of clever tricks like that. They've got a ton of different sensors, and without requiring batteries really opens up a lot of interesting use cases, so we will have an application template that makes it easy to get started with EnOcean, so come check that out. You can register for that now at losant.com/deeper-dive. In terms of further educational resources, we've got a lot. No feature in Losant goes out the door without being fully documented, so check out the Losant documentation. There's also Losant University. If you're new to Losant, that is a lot of video educational material kind of walking you through most of the components of the Losant platform. You can end with a certificate of completion, kind of get that nice certificate that says you did the work and you understand Losant. Of course we've got this deeper dive series. There's a lot of deeper dives out there now covering a ton of different parts of Losant. It can be really enjoyable to explore some of those. They're all fairly focused on individual topics, so if there's an area of Losant you're interested in, definitely check out the deeper dive landing page, kind of browse through what we have available. A lot of tutorials on our blog. We continually publish information to the blog, so check that out, losant.com/blog, and then, if you've got any questions, if you're exploring, you are running into some performance issues, you've got some of that Debug Timing tab and you can't quite figure out why a number is so big or it's bigger than you would expect, feel free to ask us on the forums. We can certainly jump in and help resolve any issues that might come up. If you do want to reach out to us and get a thorough demo of the Losant platform, all the other stuff that makes up Losant that we don't cover in these deeper dives, you can send us an email directly at hello@losant.com, or check us out at losant.com, browse our material there, and reach out to our team. With that, let's jump into some Q&A. We have gotten a lot of good questions. The first is actually really interesting. It's really high-level, but it could be cool to cover. The question is, what are workflows? Are they compiled to some kind of language? How are they actually executed behind the scenes? I thought that was kind of a cool one, really high level one. Dylan, you want to talk about what a workflow... I guess when you're done, you're dragging all the nodes in there and you hit deploy, what does that look like behind the scenes and how does that actually get executed by the Losant platform?
Dylan Schuster: It's a good question. I'm trying to figure out how much detail to go into here. When you save a workflow, that workflow and all of its configuration settings are sent into a document store, a document database, and that's where they live along with the workflow versions and things. The triggers inside of a workflow, so your device connections and disconnections and device state and messages that come in... Every time a trigger comes in, we are popping a message into a message queue, and it's waiting in that message queue where it's trying to run. It's rarely there for more than, call it 300ms, we've got SLAs set up around that to make sure that we're processing those messages in a certain amount of time. Once it's its turn to run, it gets passed off to any number of workflow runners whose job it is to actually execute the workflow, so it has the workflow that you built in, and it has the payload from the initial trigger, and it's basically going to pass that payload from node to node. It's going to execute one node, make any mutations to the payload, then look at the outputs of that one node and pass it on to one or more of the ones that follow it inside of there, and it's going to keep passing that message along and along and along and doing the various mutations and taking certain actions every step of the way. It's very close to Node-RED. If you've ever used Node-RED, it's kind of...let me look at that, there's a name for what they call themselves. It's a flow-based editor. I actually wrote a blog post comparing Node-RED to Losant Workflow Engine a few months ago, the positives and negatives of both. That's a way of thinking about it, is that it's individual processes per node doing whatever it's doing in each one, and then passing it on to the next node, and eventually of course it ends. Any time it hits a debug node, it's going to report the timing information that it accumulated all the way back up to you along with the payload itself.
Brandon Cannaday: All right, awesome. You mentioned the word payload a lot. That's a really fundamental concept within Losant. That's really what every workflow node is modifying and using along the path. Heath, got a question for you. Related to payloads, and really it's around the payload size. The workflow can add a ton of information to payload, and those things can get pretty big, so the question is, does the size of that payload have any impact on a workflow's performance?
Heath Blandford: Great question. We do get a lot of questions about payloads, and certainly they are kind of a cornerstone for what we do here at Losant. To answer the question, typically the answer is no. The size of the payload typically does not impact performance, except for that special case when you're using a Function Node. Dylan talked about the barrier, or that kind of path that the data passes. We're serializing that payload data, it's going to get into that sandbox, and then working on that data, and then pushing it back out. When you're using a Function Node and your payload is very large, you can probably expect some performance impacts when using a Function Node. Again, it's one of those things where, just like Dylan said, it's probably best case, try to use those first-class nodes that we have for some of those functions, but know that if your payload does get large and you are using a Function Node, you could experience some performance impact.
Brandon Cannaday: Okay, cool, thanks, and to add on that just a little bit, there is actually a protection limit that we have on payload size. It's 5MB when it comes to Function Nodes. So if a payload is bigger than 5MB and you attempt to put it into a Function Node, that's one of those performance catches that we have tried to protect you kind of from yourself, because we know the time it takes to serialize all that information, push it into that little safety sandbox that we have, and get it back out, once your payload exceeds 5MB, you're going to get in trouble. So you might see an error, something around "payload too large." If you do see that, that's likely because you're trying to push too much information into a Function Node. Related to Function Node as well, Dylan, you did mention some concurrency limit per application, so we did get a question about, what is that concurrency limit? Heath, since you're already talking about the Function Node, do you want to talk about the per-app concurrency limit for Function Nodes?
Heath Blandford: Sure, and just to clarify, it's not the total number of Function Nodes that you have. You could theoretically have an unlimited number of Function Nodes. This is specifically talking about the number of Function Nodes that are running concurrently. The number of Function Nodes you can have in a single application that are running at the same time is three. Not a huge number. It's why we also, again, try to tell you to not use the Function Node, but we do understand that there are some things that the Function Node just makes easier. Just know that you can only have three total Function Nodes running at a time in an application.
Brandon Cannaday: If you do the math on that, so if your Function Nodes are like 30ms and you've got three, that does equate to many hundreds or even thousands of Function Nodes per second that can be processed by your application, so another reason to make sure you're keeping your Function Nodes and your workflow execution times as short as possible.
Dylan Schuster: If I can add something to that very quickly, one thing I do want to say is, a caveat is that that concurrency does not apply to edge workloads, because those edge workflows are executing on your hardware itself, not, of course, in the Losant cloud platform. Bear that in mind. For a lot of these limits that we're talking about, that applies to anything that's executing in the Losant cloud, not down on the edge. There are still benefits and detractions to using Function Nodes even on the edge, a lot of the same things. We still spin off the sandbox and stuff. I actually don't know off the top of my head if there is a concurrency limit, but you're much less likely to run into it, I would think, in an edge workflow, just by the nature of how those are built and deployed. But that limit only applies to the cloud-side workflow executions.
Brandon Cannaday: Dylan, we do have a question about specifically edge workflows, because we covered just some of the throttles and limits for cloud workflows. We had just a general question here about, are there anything that I should be aware of when it comes to edge workflows? You talked a little bit about the Function Node, but are there any other limits or issues that people should be aware of when it comes specifically to edge workflows?
Dylan Schuster: Number one, the workflow execution timeout, which is 60 seconds in the cloud environment. That is actually configurable inside of an edge compute device as an environment variable when you spin up the gateway edge agent. It is 60 seconds by default, and actually unless you've got a good reason, I would leave it at 60 seconds. That'd be one thing to consider. Another one is going to be that, typically speaking, an edge compute device is going to be slower to make those third-party API requests than Losant's cloud infrastructure just because it's a lower power device. You have no idea what the quality of your Internet connection is going to be versus coming out of a cloud environment, of course, it's going to be one of the best in the world probably, so that's something else to consider. On that note, one thing that I always recommend is, if your use case allows it, instead of using those third-party services in an edge workflow itself, instead of using an HTTP node to make a request or any of the AWS nodes and stuff, it's going to be better for the resiliency of your workflow to instead queue up a message to send to Losant using an MQTT node and passing the payload up there. The reason being is that you can pass it up, it goes up into the cloud, and we can make that request up there, number one. Number two, and this is more important, is that if your device does not have an Internet connection at the time that that workflow is executing, that HTTP request is never going to happen. That AWS Lambda function is never going to run. However, if you were to queue it up with an MQTT node, we will hold on to that message in the queue locally on the device, and when it reconnects, then we can send all those messages back up to the cloud, and in the cloud, we can make those requests for you. I always recommend to try to pass off as much to the cloud as is reasonable inside of an edge workflow for a lot of those kind of things where an Internet connection is required for that purpose.
Brandon Cannaday: Okay, cool. The only thing I would add on that is, we do get asked fairly often, well, how many workflows per second or whatever can my edge gateway process? There's really no out-of-the-box answer for that, it depends so much on what those workflows are doing. I can give you one actual example. We had these scales for inventory management, and you can configure the scales to basically turn into broadcast mode or serial, so every scale is just shooting weight data at the edge workflow, each one about 500 times per second. Total, we had two of them, both over serial and the one gateway, this little Intel Atom based gateway, 1,000 workflows per second trying to execute, and that really taxed the processor on that quite a bit. So it's really what the workflows are doing and how much memory and CPU horsepower your specific gateway has, so the best way to know that would be some of that testing that Dylan had talked about. I'm just going to put one more question in here. I know we're over the hour, but I think it's a good one, because we didn't really get into custom nodes at all and whether custom nodes had any performance implication on workflows. The question here: "Is there a performance cost to using custom nodes versus placing all the contents of a custom node just inline in the workflow?" Heath, you want to talk about that one?
Heath Blandford: Definitely. Custom nodes are a great way for you as a Losant developer to create reusable content that you can use in your workflows. But just because they're custom doesn't mean that they have any kind of special implications on performance. They're still running those first-class nodes. Now, if you are running a Function Node inside of a custom node, the same kind of performance implications are applied. But using a custom node in a workflow does not actually have any direct implications to performance.
Brandon Cannaday: All right, awesome, Heath. Well, thank you, Heath, thank you, Dylan, and thank you, everyone else who joined us today for this deeper dive webinar. Once again, we've got another one coming up October 26 around EnOcean, so you can go to losant.com/deeper-dive, register for that one, you'll be able to go to that same location, check out the replay for this one and the replays for all other webinars. That's all we got today, and we'll see you on the next deeper dive.