

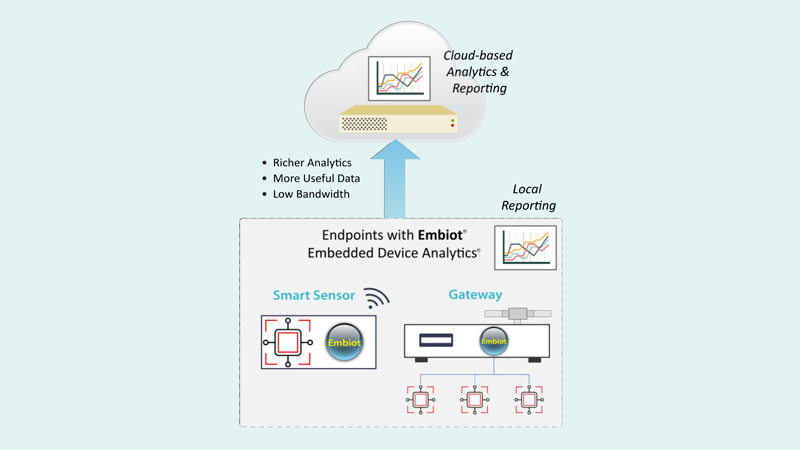

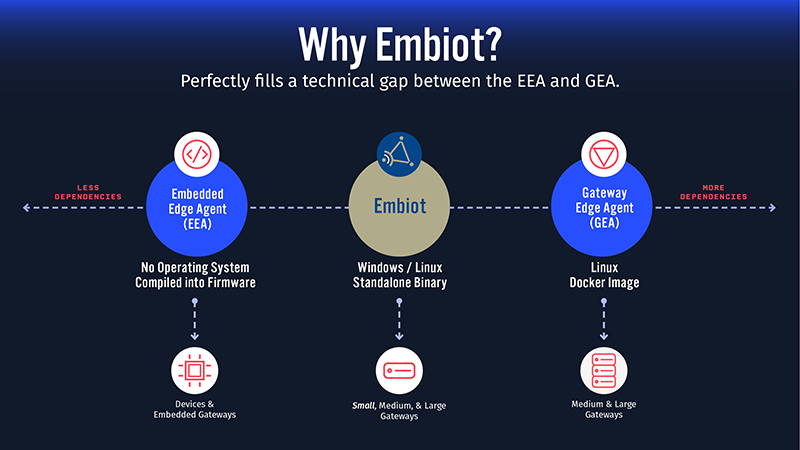


Brandon: Let’s get started. Welcome everyone to Losant’s Deeper Dive Webinar Series. For everyone that has joined us in the past, welcome back. For anyone new, welcome. If you’re catching us on the replay, well, I guess welcome at a future time. The Deeper Dive Webinar Series gives us an opportunity to, like the name implies, we’re going to dive deep into some technical concepts about Losant or, sometimes in this case, some of our partners. The webinar series isn’t designed to provide an overview of Losant itself. If you are new to Losant, I definitely recommend staying tuned. You’ll definitely learn something about Losant. Feel free to reach out afterwards and we can get a more dedicated demo and overview schedule for you at a later time. A little bit of housekeeping. The webinar is recorded. I know a lot of our viewership comes from replays. Not everyone is available live. One of the best reasons to join us live is for Q&A. We do leave time at the end for Q&A with the speakers. I want to just draw your attention in the web or the Zoom webinar tool here. There’s a button here called Q&A. Just go ahead and click that. At any time during our presentation, feel free to ask a question in there. Then what I’m going to do at the very end is we’re going to come back and answer as many of those as we can. Don’t hesitate to drop your questions in there. Speaking today, first of all, is me. I’m Brandon Cannaday. I am the chief product officer at Losant. I’m going to kick things off. Then Alan Clark is joining us. The CEO of one of our partners, Telchemy. He’s going to be presenting about their edge compute offering called Embiot. After he’s done, I’m going to come back. I’m going to wrap up talking a little bit about how Embiot and Losant work together from the Losant side of things. For everyone that is new to Losant, we are an enterprise IoT platform. We provide the software behind IoT products, services, and solutions. There is a lot of features and functionality in our platform. We’re not going to get to all of it today, but we cover everything from the edge computing all the way up to the end user experiences. Today, we are going to talk a little bit about the devices and data sources. After Alan gets done, I’m going to go in and talk a little bit about how we can use the data coming from their edge compute offering as well as the visual workflow engine. Like I said earlier, if you do want to get a full demo of everything else Losant has to offer, don’t hesitate to contact us. We’ll get you hooked up with a team member from our side. We have offered our platform, provided the foundation for a lot of companies across a lot of industries both large and small focusing heavily in the industrial equipment monitoring, smart environment telecommunications. Really exploring ways to take existing product lines and turning those into enterprise connected products. We all understand IoT is a pretty broad technology stack. It takes a village to bring an IoT product together or to life. Today really highlights one of those partners in this overall ecosystem. For Losant, we divide our partners into these three buckets to future partners where we share go-to-market strategies, low co-sale and co-marketing. Service partners who help actually develop that customer facing product. Really bring all these pieces of the stack together. Then what Telchemy is today, one of our technology partners. Losant provides a lot of the software stack but there’s still a lot more software, a lot more hardware, connectivity that’s required to pull it together from a technology perspective. We have worked very hard to build a really robust and qualified partner ecosystem around the platform that we provide. That’s all the upfront I need to do. Let’s get right into the webinar. We’re going to be talking about Embiot’s edge computing and edge analytics offering today. Before I pass it off to Alan, I wanted to share a little bit from Losant’s perspective about why Embiot at all. For anyone that is familiar with our functionality, there might be a little confusion between Losant’s existing embedded edge agent and our gateway edge agent and where Embiot, another edge computing offering, fits in this overall technology stack. We met these guys quite a while ago. They showed what they had. I really liked that it filled this technical gap. This perfect slice of technology between our edge agent offerings. On the far left, you’ve got the embedded edge agent. It doesn’t require an operating system. It really has no system dependencies, but it’s compiled in the firmware. It takes a lot of upfront development work to get that working. The tradeoff is you can run that on very small devices. It’s designed to be built right in the device firmware or run on what are called embedded gateways, which are gateways that you may not have access to the underlying operating system, but they provide some application space. Then on the far right is our far-right edge agent. It requires a Linux. A lot of system dependencies. It requires Docker. Designed for those medium and large gateways. It requires a few more system dependencies. Where Embiot fits from a technical perspective is right in the middle. When we think about industries that might be attracted to this offering, I really go to that industrial equipment monitor. We see a lot of our customers adopting gateway retrofits. They want to include an off-the-shelf gateway. Sometimes integrate it directly in the equipment or the chassis connected to the controller itself. The embedded edge agent, that’s a lot of upfront work. You may not need that level of custom firmware development. A gateway edge agent leads to these more expensive gateways where the unit economics may not work out. For those companies that are thinking about small and medium gateways, still using an operating system, something like an Embiot can really reduce that cost. Reduce the unit cost to get some edge computing out there and get that data up into the Losant platform where then you develop a customer facing application. With that, I just want to spend just two minutes there for the returning users that are familiar with Losant to understand where Embiot fits within our product portfolio. Now, I want to hand it off to Alan. He’s going to give us a much deeper dive into Embiot. How it works and how to start sending that data up to the Losant platform. With that, I’m going to hand it off to Alan.
Alan: Great, thank you. Thank you, Brandon. Let me just share my screen. [Long pause] Can we see my screen?
Brandon: Yes, I can.
Alan: My name is Alan Clark. I’m the CEO of Telchemy and I’m going to talk about Embiot, which the name comes from embedded and IoT obviously. Telchemy was founded in 1999 so we’ve been around for quite a while. The picture that was shown of me on the earlier slide is very dated. I look a lot older than that. We have a focus on embedded analytics and edge analytics. Our initial products were focused on voice over IP, and also video streaming, and video conferencing. We have an install base of over 500 million units of that technology. We have a long history in the embedded analytic space. Not so much in industrial IoT. More in voice over IP. Embiot is a new product we introduced just about the time COVID started, which is focused on applying what we’ve learned from our work in embedded analytics, and analytics to the IoT space. The approach is to use a low code approach. In other words, something that you write code for but it’s very simple. A very small amount of simple code, easy to use, feature rich, a number of well-defined methods of getting data in and out, and a rule-based programming language. I’ll show you all of this shortly. It uses a compute flow or stream processing architecture internally because this is a good way to handle asynchronous data streams. If you’re connected to a lot of different sensors, then data is going to arrive at different times and make its own way through. You may have to deal with missing data or data that’s delayed. It has a rich set of functionality. In each of the nodes in its stream processing architecture is a function that could be simple or complex. We’ve built it for multiple platforms, so Intel, or ARM, and then Linux, Windows, and Mac OS. It’s small footprint. What we mean by small footprint is around 300 Kbytes including all the code. It also includes a runtime compiler. You basically just write code, run it, and it compiles and executes. It has a low fixed memory usage. It doesn’t allocate memory on the fly while it’s running. It decides how much it needs, allocates it, and then starts. High level looks like this. As I mentioned, you have a runtime compiler that takes your program file and builds this. You have a number of methods of getting data in. You can just send data to it through a socket, or it can do polling. It can do MQTT and MODBUS polling. It automatically detects the protocol. It knows about JSON, and XML, and name equals value. It matches the metrics that you’ve defined and then queues those, queues the input values, and then computes them. Data flows through this stream processing model. Then on the output side, in intervals, it’ll take the output values and generates a report and send it. It can send reports to multiple different places. It does include an MQTT implementation as part of all of this, which we’ll show you. The advantage with using the runtime compiler model is that it very much shortens the whole time it takes to get code built and tested. You can have something running. You can just stop it, edit the code, and start it up again in a matter of a few seconds. It’s very good for experimentation or for once you got it working and just leave it running. For small to medium size program files, it’ll compile in a second or so. It compiles, it configs, it will program a file into an executable compute flow, pre-allocates memory, and queue sizes, and buffer sizes based on what it thinks you’re going to need. Then when it runs, it actually saves some statistics in a memory usage and a buffer usage. The next time you run it, it’ll actually resize the buffers based on what it knew it needed from last time as opposed to just its default values. On the input side, it really is designed to try and make life as easy as possible. You can just send the data through a UDP or TCP socket using some arbitrary text protocol. You can use name equals value, and then COAP value, JSON, XML, URL encoded data. It’ll automatically figure out what format it was and then extract the metrics and try and match them with the metrics you’ve defined. It supports ACCP, or ACCPS put in post. Again, you got a variety of ways the data can be encoded. It accepts an MQQT publish, which could be an unsolicited publish. In other words, somebody could just set it to publish, or it could result from a subscription. It is capable of subscribing if you want to. If you declare a device is an MQQT device and provide it with a topic string, then it’ll subscribe to that device, to that topic. As a result, it should get MQQT published messages back automatically. Then it can do more explicit polling via MODBUS or TCP gateway. Also, it can do HTTP, or HTTPS get polling to. We’ll show you that. Then we’re in the process of adding COAP and also direct IO. By which I mean the ability to directly access things that are located in memory or IO space on the hardware. Now the computer flow part of it. Essentially, it’s a series of interconnected nodes. Each node is going to do something. It can be a very simple function, like add two things together. It can be a fast Fourier transform, an autocorrelation function, a neuron, fuzzy logic. It can all sorts of different things. Basically, data is just going to flow through an interconnected series of nodes having things done to it. Then eventually, you get output, which is the fondest part of a report. The nodes also keep track of things. They don’t just hold the value. They also keep track of the last value, the last time that node is updated. If there are any math errors, it counts those for that node. If there are any timeouts, in other words, data didn’t arrive on time, then it can count that too. That way that information is available for each node. If you’re trying to debug what’s going on with a series of operations like data, it actually can give you quite detailed information internally from within this network of nodes. The functions are somewhat designed around use cases. For example, within FFT. FFTs typically produce a whole bunch of output coefficients. What you really want to know are the things like the harmonics, and spectral peaks, and those kinds of things. The FFT function, it computes the FFT, but it also calculates, and finds the harmonics, and spectral peaks. Those are just available from the output of the node. The output of the node can give you the full set of coefficients or it can give you the first, or second, or third harmonic. Then if you have multiple logically separate flows of data going through the same system, then you can have logically separate groups of nodes. They don’t have to interact with each other if they don’t need to. Then on the output side, again, we’ve tried to make things fairly easy to do. Those reports are generated either at fixed intervals or they could also be generated when an alert condition occurs. The report outputs can be in MQQT. It could accept a subscribe, or send a publish, or it can just send a publish. It can do HTTP, HTTPS post or put, like a rest API. You can create a custom text template and it’ll substitute values in the template with metric values. Then it also allows you to use a web browser just to get the value, which can be in JSON, XML, or HTML table. You can just use a browser to do that. You can generate as many reports as you want to different destinations. These could all be different places. The high level then, it’s a small footprint embedded IoT analytics agent. It’s low code. I’ll show you some examples in a minute. Easy to program, allows rapid development. It’s programmable, customizable in the field. All you need is a text editor, and you can change what it’s doing. It’s got advanced functionality. You can implement things like neural nets in if you want to. Small footprint, multi-platform, incorporates a range of input and output methods, and also supports TLS security. The demo we’re going to show you. I’ll walk through what the code looks like and also do a demo of this. The demo setup is just Embiot running on a Raspberry Pi 4. The code size on this platform is 229 Kbytes. It’s going to interact with some MODBUS sensors using MODBUS TCP. It’s also going to get information from an API, a webservice API on the internet, openweather.org. It’ll do a combination of getting data from some MODBUS temperature sensors and getting data from the weather API. Let’s take a look and see. The installation of Embiot is fairly straightforward. It’s a simple single binary. We can build it with and without TLS support. If it has TLS support, then it does use open SSL. It would need that to be installed on the platform it’s on. Obviously, you would have to have certificates available if you needed them. What you require is the Embiot executable. The identity file, what’s called Embiot.idf. This holds things like your organization ID, a license key, and some other properties. Then something.cfg is the configuration or program file. That’s actually what gets executed. To execute it, we just do Embiot minus C and then the name of the config file. What an Embiot program looks like. There’s a number of options. I’ll show you some specific examples in a moment. There’s a number of options you can set. You can tell it to run in higher speed mode or lower power mode. You can tradeoff throughput versus CPU usage. It’s got a lot of debug options available. You can define the listening ports that you wanted to open really for it to accept things. That kind of thing. You define report blocks, gateways, and brokers, device classes, and devices, metrics, and rules. Let’s go through each of those. For a gateway, this is actually from the demo I’m going to do. For gateway, this is a MODBUS TCP gateway. We give it a name. In this case, we’re giving it an IP address. It could be a host name, but we’ll give it an IP address and a port. Then we’re saying that the protocol is MODBUS. Then we could also define the MQTT broker, so this is Losant. The broker’s name is Losant. The host’s name is broker.losant.com. Port 1883. You can set various MQTT settings, like QoS level. These are mangled a bit. These are the client’s ID, username, and password that Losant need or at least representations of those. Then for devices. We have a device class structure because the assumption is you may have quite a few of something. If you do, then you can define a device class for it. In this case, we have two temperature sensors. We’ve defined these are being of class MODBUS dev. Their protocol is MODBUS. We’re going to poll them every 25 seconds. I’m not a big fan of MODBUS. I know it’s hugely widely used. In MODBUS, you have numerical registers. In this case, the temperature is 30,000 at two and humidity is 30,000 at three. Then you can define what type these are. These are integers. The byte ordering, byte word order. These are inputs. Now to make it easier to work with in the rest of the code, it’s easier to give them names. What we’ve done is we’ve said the register named temperature corresponds to MODBUS address 30,000 at two. The rest of it applies. Now we can refer to these as temperature and humidity. Then to make life more convenient, I can also define my own variables as part of this. Even though temp C, temp off C, and humidity off are not part of that MODBUS sensor, by creating those as user defined variables, it means that I’m automatically going to create those in the same namespace. It just makes it easier for me to work with things later on. Then I can define my devices. I can define as many of these MODBUS dev devices as I want to. I’ve just called them sensor one and sensor two. In this case, just two of them. They’re of type MODBUS dev. I can get to them through the MODBUS gateway we defined on the previous page. They’re at MODBUS address one. Sensor one is at MODBUS address one and sensor two is at MODBUS address two. That’s basically all I need to do. If I had 10 of them, I’d just carry on doing the same thing. Then this automatically creates a hierarchically named metric. The fact that I defined sensor one as sensor one and of type MODBUS, it’s going to automatically create something called sensor one/temperature, which I defined up here. Sensor one/humidity and then also sensor one/temp C, temp off C, and humidity off. The same thing for sensor two. I can use those in my later rules if I want to to manipulate those values. If there are things that I want to do which are outside of the metrics that will be created by doing that, then I could just define them. I can say metrics equipment when humidity is an integer or equipment room temp air is a float. I can just define those. Then I define rules. My rules are exactly what you’d expect. It’s the humidity value that comes from these sensors is actually scaled by 10. You have to divide the value by 10 to get the real humidity. I can say the equipment room humidity is sensor one/humidity divided by 10. I can do compound functions. I’ve got lots of math functions I can include in here. It’s very algebraic language. Here I’m converting sensor one temp C, scaling it by 10, converting it to degrees Fahrenheit, and then rounding it. That becomes equipment room temp F. Then reports will look like this. Again, it’s another block. You have a report name, report type MQTT. We want to send it through to the Losant broker, which we defined earlier. If I say report CLA true, then it’ll also output the report to the command line so I can see what’s going on if I want to. The being MQTT, we need to give it a topic string. That’s the report topic. We want to encode the data in JSON. Send it every 10 seconds. We want it to work. It’s saying enable it. If you want to just run it in test mode, you could do reports enable false and report CLA true, and you’ll just see it on the command line. Then you can define a numerical or text value for unavailable. In other words, if you have metrics that are not available, it would substitute whatever you put there for that value. Then you put the list of metrics that you want in there. You can also put wildcards in here. In this case, equipment room might have two different equipment room values and two different serve room values. I can just put a wildcard in there and it’ll put both in. Let me switch across now to look at something. This is Embiot running. It’s basically reading the values from the two sensors or in this case building, and also getting the value from the weather API. Just the last one. It’s 82 degrees here right now. Then it’s sending those through MQTT. We’re getting PUBBACK. Now, I might want to see a bit more detail. This is the actual program that’s running. Because I said debug mode MQTT, it’s showing me that very summary level. I sent a publish so I got an acc. We can do detailed. We can do polling. I can save this and exit. Then all I need to do is just to restart this. You saw it started almost instantly. Now it’s running the revised version of itself. It’s connecting back to Losant. Now with MQTT detailed, it’s actually showing us the detail of the messages that are being sent and received. You can see all the gory details. I also turned on polling, a debug, as well. We should see in a minute the polling information. This was the poll. Scroll back down to that. This is it polling the two MODBUS temperature sensors. These are the values coming back. You can see the request going out and the response coming back. That value, in a minute, will start to appear in the reports that are being sent. It does a MODBUS decode. Then this big chunk of text here is the request it’s making to the weather API service. It’s sending a get, requesting the weather for this location, and this is the response coming back. You have the coordinates, weather, and so on. It’s in Alpharetta, Georgia. You can see all the details that are coming back. What I’m doing is I’m pulling some values out at there and then incorporating them into the data that’s being sent. That value is actually going into this unique ID 6. Now there are other nice things you can do as part of this. Something we’re doing here is to use aliases. What we wanted for this demo, we wanted to have the reports that came out that showed the same things. Basically, they all say temp F, temp C, humidity, unique ID even though they represent different sensors in order to make that easier. Our metrics actually have very specific names, so equipment room temp F. What I did was to create aliases for all of these. Then when I put that metric into the report, then it’s actually equipment room star here. What it’s doing is inserting equipment room temp F, temp C, and humidity in there. It’s using the aliases to put in the report. That way it lets me give them more very generic names even though when I’m working with them down here, they’ve got specific names. That’s that. Let me just exit from this. Then something else we can see here, just a practical point. We’ve got quite a lot of logging going on. This is the program it’s running out of. The folder it’s running out of. You have the Embiot executable with 228K. There’s the configuration file we’re running, which is 3.7K. Then we have various log files that are going to indicate if anything is going wrong. We also have this PRF file. The PRF file provides performance statistics. That can be useful to figure out if things are not working the way they ought to. It has all sorts of things like processing delays, and key rights, and messages received, and messages sent. A lot more detail than you’ll probably need. If I look at the Embiot IDF file, this is our identity file. We have a license key. The location of the license server. You could also do remote configuration. There is a portal called portal.embiot.io. That’s where the license keys come from. Also, it has a configuration section on there. You can put a configuration in there and tell Embiot to automatically check back. It’ll check back there at whatever intervals you tell it to and see if there’s an updated config file, a later version of config file for the one it’s running. If there is, then it’ll download it, exit. Then if it’s running as a service, then it would automatically restart using the new config file. Then you have various fields down here. The vendor ID. Some fairly free usage things, like device type, device version, device ID, location, and so on. Those you can use to identify this. You can also use this for matching configurations. If I had a configuration file on the server, I might use it and I might say this is for Project R Pi 3, Alpharetta Raspberry Pi. It’ll check for something that matches that, and then download it, and use it. Those are the key elements. I’m going to switch across to Brandon now so he can show you the other side of it.
Brandon: Thanks, Alan. Let me share my screen. While I’m bringing up my screen, what we just covered was the configuration required to read some data from some MODBUS devices and then report that over MQTT to a custom topic up in Losant. Of course, that concept will apply to basically any broker you’re using. What I want to show now is a little bit of what happens when we get into the Losant side of things. What architecture we really displayed here is really interesting. Not one we’ve ever covered on a Deeper Dive Webinar before, which is first of all, reporting to custom topics. Normally, most of our webinars are reporting to those special device topics, like state or the platform just directly understands the data. This is demonstrating an edge computing or a gateway that’s reporting to other custom topics. I’m not going to cover the data visualization side. We’ve covered that so many times. If you do want to know, how do I put my data on a dashboard, we’ve a wonderful walkthrough that does pull data from a weather API and covers how to put that on a dashboard. That I’m not going to cover today. The first thing I want to talk about is showing that data once it hits the platform. Right in here we’ve got the application communication log. It’s on the overview page. This is probably one of the most important things to pay attention to as a new Losant user. We can see right here that we’re getting that raw message. This is based on one of the reports that Alan just showed in the configuration. Like he showed with those aliases, we’re getting data for multiple devices all with the same field names, temp F, temp C, humidity. What’s changing is the unique ID. This is a really common edge architecture where you may have a gateway reading data from multiple, identical, or very similar devices. In that incoming pay load, you have to include something that can uniquely identify that device. That’s really what I wanted to show here in this portion of the deeper dive. If we do look at the device hierarchy here, we’re making use of the gateway and peripheral concept within Losant. We’ve got great documentation on that. That’s what I’m showing here is our documentation page. We switch back to the portal, we’ll see that is represented here as the Raspberry Pi gateway. You can also run Embiot on a MacBook. I know that’s one of the things that Alan said. What we have connected in sending data right now, is that Raspberry Pi. That’s the gateway. Then we’ve got these three peripherals. The two MODBUS devices. They’re identical devices but they’re collecting temperature and humidity data for two different rooms. Then we’ve got the one representing the weather. What I’ve added here is the tag that corresponds to the identifier sent to the payload. Great pro-tip for Losant users. If you’ve never noticed this little customized column button, definitely explore that. It allows you to add additional columns to your device table. What I’ve done is added the unique ID tags so we can see the four, five, six, that map. The ID is coming through the platform. If we go and open one of these up, we’ll just see down at the bottom we do have that tag. Then if we scroll back and look at the attributes, we’ve got the humidity, temp C, temp F, and then we can see data flowing in here. One of the most important things to remember when using custom topics is Losant takes a security model of opt in. You have to grant access to devices when it comes to custom topics. Devices, connections into your application to our MQTT broker just can’t arbitrarily read and publish data. You might accidentally expose information you don’t want. When you are creating an access key, what you’ll need to do when using custom docs is come down here and specify what you’d like. In this case, I only want to allow the following topics. This is that Telchemy topic here. We do support wildcards. Pay attention to that. If you’ve got a device, and you’re attempting to publish on custom topics, you don’t have the access key configured correctly, what you’ll see in that application communication log is an error. It’ll say device attempted to publish on a topic it wasn’t allowed to, and it’ll disconnect the device. If you are seeing that, that probably means the access key doesn’t match the topic you’re trying to post to. If we switch back here, we can see we’ve got raw JSON data coming into the platform. Losant doesn’t really know this is JSON data. It’s not inspecting those MQTT payloads. That’s where we’re going to switch to a cloud workflow in order to decode and then ultimately report the data on the correct device. This is really where that peripheral gateway association comes in handy and also the unique identifier specified in the payload. Let’s check out the data handler workflow. This is the meat of this whole architecture. Also, a good place to talk about one of the main differences between how you program Embiot versus Losant. What Alan showed is very declarative approach to edge computing. It’s almost like a programming language. Losant takes a flow-based approach. That declarative approach can be simpler in some cases. In this case where I’ve got MODBUS devices. I just need to get the data, read them, and report them. He did show some really nice edge analytics there. Very light. I think just barely scratched the surface of what Embiot can do with streaming analytics. That’s a lot easier to version control versus a workflow. Can be easier to do those very simple tasks. It’s a very different way to design your edge logic but it can be beneficial in certain circumstances. In this case though, I’m looking at a cloud workflow. The very first thing that’s happening is we’re triggering whenever data is received on that topic. This is one workflow that will support data for any number of fielded devices. It’s a very important concept in this architecture. You don’t want to field 10,000 of these edge devices and have to build 10,000 workflows. We really want to design a data architecture and a hierarchy where I can build one workflow. All the data gets funneled to it. Then I can make decisions in that one place. After that as I mentioned, Losant itself doesn’t know when you’re using custom topics. It doesn’t make any assumptions on the data format that you’re reporting. In this case, we are reporting as JSON, but you can report really any arbitrary bits and bytes in an MQTT payload. The first thing we have to do is decode that data. We have a lot of decoding nodes, encoding, and decoding nodes. In this case, it’s JSON so we’re going to use the JSON decode node. It’s a nice little trick. That raw JSON string is coming in on the data. I just decoded in place. Now when I look at my payload, I see the actual payload that was sent. It’s just right in line. It replaces the raw string with the decoded string that now, it’s a little easier to use. Then now that architecture we talked about comes into play. The first thing is a device get. This is the really important node here. We’ve got the gateway ID. What we want to do is find the right device. Let’s pretend again we’ve got 1,000 of these gateways that all kinds of sites. They’re all reporting data for basically the same type and peripherals. You may be building a smart environment product and selling it to all your customers. They all had the same sensors that go along with it. You don’t want to build these workflows for all of them. You just want to be able to look up the right device. In this case, we’re looking for all the devices whose gateway ID, going the opposite way, a peripheral has a parent gateway that’s equal to the device that came in. This is a little pro-tip that a lot of people may not know. It’s a hidden feature of Losant. This relay ID property. It does represent a lot of different things in Losant but it’s usually representing what generated the data. If you click a virtual button, the relay ID, the ID of the virtual button that ultimately clicked it. In this case, the relay ID is the device ID that published to this incoming topic. We can use this to know which gateway, which MQTT client actually published this message. That’s what we are mapping right here. That relay ID is here. Then we’re doing that unique ID lookup. It’s okay for devices at different sites, different peripherals of different gateways to have overlapping unique IDs. We’re also scoping it to the relay ID. Another really common ID that comes in might be the IP address. I’ve used that in a lot of cases especially for MODBUS. I might just report here’s the IP address of that MODBUS device on the network. Then I can tag Losant with that same IP address. You may have two devices on two entirely different custom customer networks have the same IP address. That’s totally fine. This is a good way to look that up. Coming out of this. This is how we identify the right device, the right gateway, and peripheral that ultimately reported this data. We do a quick check. Do I even have the device? This is a really good spot to do maybe some on demand device creation. If it makes sense for your application, if you receive a new piece of data for a device you don’t know, you could have a recipe in Losant. You could create it here, and then bring it back, and continue the workflow. This is really where naming those aliases that Alan talked about add a lot of power. I don’t really need to know this peripheral has these attributes. This peripheral has these attributes. This architecture, the peripherals are all identical sensors. They all have a humidity temp F, temp C. After I found the appropriate peripheral, I can just report those data. I know it has those attributes. I know that those values are on the incoming payload so I can just report them here. What that results in is devices over here that do have that incoming state. Every 25 seconds or so, based on that polling interval for the MODBUS devices, we’re getting this device state data. That’s really what I wanted to show from the Losant side. I thought this architecture of the edge devices out in the wild all having similar peripherals. We see that a lot. A lot of gateways are reaching onto local networks, reading identical sensors, reporting up that information. This is a really nice deep dive into that architecture. Now I’m going to wrap it up. We’ll have the rest of the time for Q&A. It looks like we do have a couple of questions. The first thing I want to do is if you are a Losant user, we are really excited for you to leave some reviews on these platforms. Just share your experience with the world. Help get our name out there. That would be very appreciated. The next thing is a save the date. Just next month, late September, we’ve got Brian Cerchio who leads our internal solutions group. He’s going to be talking as part of the IMC fall days about what makes IoT projects succeed. He is probably one of the best people in our team to understand that. He does lead the development directly hands on for a lot of our customers as they’re developing their solutions. Please check that out at losant.com/events. You can register for that and catch that talk. Some additional resources, some follow-up information you might want to check out. If you do want to see more about Losant specific edge compute functionality, as I mentioned, it does work a little different, flow based, you can find that in our documentation. Go to docs.losant.com. You’ll see the edge compute in the left-hand nav. We do have a nice demo of our data visualization. I didn’t cover it here. If you do want to see how that works, oftentimes, the next step after recording that device state onto a device is then to go to the dashboard to start presenting that. We’ve got a great data visualization demo you can check out. Also, is workflow alerting. Check out this template in our library. Losant does ship a lot of prebuilt functionality. Definitely explore that template library. We showed us bringing data in, decoding it, and storing it. A lot of times, one of the next things you want to do besides visualizing it is also set up some alerting. I want to capture those exceptional occurrences. I want to then notify the correct personnel. It might be service support technicians. It might be your end customers. Something is wrong with the equipment that they purchased from you. It’s a nice little template to lay a starting implementation that you can expand on. Before we get into Q&A, these are just our general support and documentation resources. Always worth exploring. That middle one there, the Deeper Dive series, we’ve done a lot of these that cover a lot of partner technology, like today, but also a lot of just Losant implementations. If you’re in there building out end user’s experiences or building solutions, certainly explore that. It’s a very valuable resource when it comes to learning how to do Losant. Then reach out to us on our forums. We’re always there. A lot of our team hangs out there ready to answer questions. If you’ve built something cool, certainly let us know. Show us what you’ve built using Losant. Us in the community love to hear it. Let’s get into the Q&A. First up, I mentioned early that the Embiot is great for small gateways. I certainly didn’t define what small meant. This demo Alan used was a Raspberry Pi 4. The question we got is what is the minimum platform that can be used? I guess the minimum system specs. Alan, do you want to tackle that one?
Alan: Yeah, sure. The minimum system is something that requires a list of minimal, Linux operating system with multi-thread support. We’ve happily run Embiot on, for example, Raspberry Pi 0. In terms of actual CPU consumption, you know memory consumption, it’s actually relatively small. It does require a basic Linux that’s able to support multi-threaded operations. It’s not available, for example, on an ArtOS that doesn’t support that.
Brandon: Thanks. Next question is Alan, you showed a lot of local editing of the configuration. Do you provide any remote portal or any way to update that configuration remote? The device is already in a customer’s hands or something like that.
Alan: Yes, to a degree. There is an Embiot portal. Customers have access to that. Within that, there is a configuration section. You can create a configuration and put it on that portal. Then the agent will automatically check back into the portal to get a configuration file for itself. It uses the properties that were in the IDF file. There were various location device IDs and things like that. It uses those properties to try and match a config file. If you started up an agent, and it’s IDF file says do go and check in with the portal for your config file and it doesn’t have one, it’ll automatically go to the portal. It’ll share those properties. It’ll say on Project Losant or whatever. Then the portal would try and find a configuration file for that customer with the right ID that matches that property. It’ll download that config file to the agent automatically. The agent would then save that and then restart. Then it would periodically check back. If you wanted it to check back every 30 minutes, or 24 hours, or whatever, then it would check back and go through the same process to see. The a configuration files are versioned. It’ll check back to see there’s a later version of the same config file.
Brandon: That makes sense. An interesting follow up to the remote portal is does Embiot have an API? The reason is they’re building a Losant experience. They want to enable some amount of that device configuration or device management to the end user through a Losant workflow hitting maybe an Embiot API. It looks like the ultimate questions is really does Embiot offer an API where you can do that management through external services?
Alan: Yeah, specifically, for the configuration part of it, I wouldn’t say there’s explicitly an API. It’s a fairly simple rest protocol that’s used by the agent to go request things. We’re quite willing to share that. We don’t regard that as proprietary. It would be possible for somebody in Losant or a Losant customer, if they felt it more convenient, to implement the configuration server functionality themselves just using the same protocol.
Brandon: I’m going to go ahead and wrap it up here. It looks like we’re basically at the top of the hour. This final slide here is really just how to learn more about Losant, and Embiot, and Telchemy. You can find us at losant.com or shoot us a message at hello@losant.com. You can find Embiot or Alan at telchemy.com/embiot.phb. This is where you’ll want to go to find next steps. Thank you, Alan, for joining. Thank you, everyone else, for attending. We’ll see you on the next Deeper Dive.
Alan: Right, thank you.