


Kevin Niemiller: It is now two minutes after the hour so we are going to go ahead and get started. I wanted to first thank all of you for joining the Deeper Dive Webinar today. Today's topic is on combining the power of InfluxDB with Losant. We will learn how we can store, visualize and query time series data at the Edge by using both InfluxDB and the Losant Edge Agent. Today, we will have a couple different speakers. I am Kevin Niemiller, a Solutions Architect here at Losant. We have Sam Dillard, a Senior Product Manager Sam Diller at InfluxData. Sam will be giving us an overview of InfluxData and their InfluxDB product that we will be using today. Finally, we will have Heath Blandford, a Customer Success Engineer here at Losant. Heath will walk us through the technical part of this webinar and show us how we can get started using the Losant Edge Agent and InfluxDB together at the Edge. Before we go any further, I want to provide a couple housekeeping items. The webinar is being recorded and the replay will be made available to you in a few ways. After this webinar, we'll send you an email with a link to the replay and the webinar will also be made available on Losant’s YouTube page as well as on our Deeper Dive webpage. Throughout the webinar, you may have questions that you'd like to ask. I would like to point out a couple of key features in the Zoom conference. You can use the Q&A feature or the chat feature to post questions and I’ll be monitoring those throughout the call. At the end of the call, I’ll moderate a Q&A session with the posted questions. Let's do a quick review of Losant and our enterprise IoT platform. Losant is an application enablement platform. What that means is that Losant provides enterprises with the building blocks to create their own IoT products. Our platform consists of five key components to help customers achieve that — end user experiences, a visual workflow engine, data visualization which also includes integration with Jupyter Notebooks, devices and data sources and Edge Compute, which is where we will be focusing our time today. Our customers and partners utilize these five components to create the robust IoT products they put in front of their end users. Losant is a leader in the industrial, telecommunications and smart environment spaces and we've offered this platform for all sorts of customers ranging from startups to companies in the Fortune 100. If you're interested in learning more, please reach out and we would be happy to set up some time for a much more in-depth conversation. While Losant provides a software foundation for IoT, there are many other components that have to come together to create this IoT application. We've surrounded ourselves with a great ecosystem of partners. This includes strategic partners with whom we share sales and go-to-market strategies, solution partners who work with clients to develop end-to-end IoT applications and lastly, technology partners that can provide hardware, connectivity and other services to complete an IoT solution. Let's go ahead and jump into the main topic today and talk about why InfluxData. In this slide, you can see two main parts of an IoT solution — the Edge and the Cloud. Everything in the Edge box represents hardware at the Edge. In the customer's environment in a typical IoT application, using the Losant Edge Agent you will have devices reporting data to the Losant Edge Agent which is installed on a local gateway in that local environment. The Losant Edge Agent can then do local processing of that data and ultimately forwards that data to the Losant platform so that it can be made available in the end user experience. We have recently had a couple customers ask how they can also visualize the data at the Edge by building an Edge dashboard that works regardless of internet connectivity. This is where the power of InfluxData comes in. They have a great product called InfluxDB which is a time series database that can be installed at the Edge and also provides local dashboards. With InfluxDB, we can now save the data from the Losant Edge Agent to InfluxDB and build a local dashboard to be displayed at the Edge in the customer's environment. In addition to InfluxData offering InfluxDB, they also offer a host of different services to help properly set up that time series database and optimize it. I am now going to pass it to Sam so that he can talk more about InfluxData and InfluxDB before Heath walks us through the technical demonstration of building a local dashboard at the Edge.
Sam Dillard: All right. Thank you, Kevin. I’m going to share my screen here. Hopefully, that is visible. Kevin, can you confirm that?
Kevin Niemiller: Yes. I can see it.
Sam Dillard: Cool. Hey, everyone. I’m Sam Dillard. I’ve been with InfluxData for five years now and I’m recently a product manager for the IoT space so I was asked to come here and provide some background on Influx and sort of provide some context for what Heath is going to eventually demo for you later. The agenda just for my portion here is basically some background on time series itself and then InfluxDB, kind of why specifically I’m here even though Kevin did touch on that as well. The first thing is to level set on what time series data is. That may be obvious to most of you but I just want to might as well start from the ground up and then what is the nature of time series data and what kind of implications does that have on the way you store it and the way you access that data. And then of course, why InfluxDB, some information on...some high level and maybe even a little bit of lower-level information on what Influx is and what it provides you. Quickly, to level-set, time series data is just essentially a sequence of values pertaining to something, to some axiomatic low-level object or metric where you're basically tracking any change in any values it emits over time. If that's not clear, I have some visual aids for that. But basically, the most tangible example of this is some kind of line graph where you have sequential time on the x-axis where you're plotting different values as they change over time for some thing. I say thing because I'm being intentionally ambiguous. Pretty much anything that's emitting data can be emitting time series data. What you're looking at is the change of certain values over time. This is an example of not time series data but it's still data that's very common. You have users that use certain applications and you may have a machine learning algorithm that that predicts what people like. That's useful information but it's not time series. There's no point in storing time stamps necessarily for a query where you want you want to understand who likes what, who interacts with what applications and things like that. So, time is not relevant here. Another example of time series would be financial data. If you're monitoring your own stock portfolio or cryptocurrencies, you've probably seen candlestick graphs like this or just line graphs monitoring the change in stock prices or prices of cryptocurrencies and whatnot. Doesn't always have to have an axis though. This is an implied x-axis where we're looking at the plays of the song Sing by Ed Sheeran over the course of a few weeks. This is the change in plays or the count of plays over time, so this is time series data. This one's a little bit of a... This is fun but kind of a red herring. Time is on the x-axis here but it's not sequential time. Time spent studying is basically buckets of however you want to bucket up your time. You may have zero to one hours, one to two hours, three to four hours. Those are buckets of time spent studying and how it relates to grades but there is no relation to time as it progresses forward, so this is not time series data. With that said, we make some assumptions about what time series data is. Because of the things that I’ve mentioned, the time series data is not replacing values over time. It's adding values over time because we're storing a history of those changes. By nature, time series data is higher volume than most other data sets for when you're looking at the same number of things because you're constantly adding to the data set. I say append only, append mostly because there are some exceptions to that rule but generally speaking, it's an append only type of workload. Now, to add to that, equipment just in general, servers and IoT equipment, industrial IoT equipment are getting more expensive and people are getting more in tune with the importance of detailed monitoring of these pieces of equipment to avoid missing out on potential failures. The precision or the accuracy of this time series data is increasing which means the data is getting more granular. So, what would have been maybe people taking metric samples of their equipment every 15 minutes or so is now down to 5 minutes, 1 minutes, 1 minute, maybe even 30 seconds or 1 second depending on how important that data is. So, the precision is increasing. However, one assumption of time series we can use to improve our experience with time series is that data has a half-life, if you will, basically sort of a slow expiration date where time series over time loses its value. There are exceptions to this rule but generally, we can assume that the more recent the data point, the more value it has. We can actually treat the data as such to improve our experience with working with it, and I’ll talk about that in a second. But the last thing is, okay, you've got your data in your database but now how do you work with it? There's naturally an enormous amount of data that you're going to potentially work with so you need some kind of tool that can do very fast lookups for that data as well as very fast computation on that data for just rendering data in a dashboard or even probably more business critical, running alerts on that data. Just a quick little visual example here to talk to the value of precision or granularity, they're kind of synonymous here. This is just a 15-minute window of CPU on my computer. I did a stress test and I sampled some CPU on my computer. The top graph is a sample taken every minute over that 15-minute window and then that is on the bottom, juxtaposed over another data set that is sampled every 10th of a second. So, what is that, 600 times faster or more granular. What you'll notice is that minute lead data is missing, which is the blue over the purple, is missing a whole bunch of detail that's happening with the CPU. The purple is capturing that detail. With CPU, you may not care about that kind of thing but with very expensive industrial IoT equipment, you might. This is why the value of precision is increasing. That said, I want to touch again on how we deal with the idea that data has a half-life. This is a term down sampling is a very common term in the time series world. On the left here where time is moving from left to right, you have your ingest where you're writing in your raw high precision high granularity data. You may not keep it around for super-long but while it's being written, you're aggregating it with some functions like maybe mean, min, max or all of the above and writing it to somewhere up to some other place in a less granular form but still with that, still capturing the trend over time. You can do that sort of in a federated way where over longer and longer periods of time, you down-sample your data further. This obviously has good storage footprint implications but also, increases query performance. So, if you wanted to query back six months’ worth of data, you don't necessarily have to query six months of raw data. If you're already going to aggregate it in the query, you might as well query pre-aggregated data. That makes lookups and processing much faster. So, why Influx? Obviously, that was the next step. Well, the first thing, the most relevant thing to this topic is that it's very good at running at the Edge. It's very efficient at what it does given the nature of time series data and what time series databases have to do, Influx is very efficient with the hardware that it uses. It can run on Raspberry Pi's and even smaller microcontrollers as well as just limited resource servers that you may have at the Edge. I think really why Influx was chosen for this for the back end of this demo that Heath will go over. That's probably the main point here. However, in addition to that, it is a fully open API. So, as it's running on the Edge or if you're using the Cloud version, you can kind of write to it however you want, query from it how you want and it does have its own UI whether in the Cloud or at the Edge. So, you can have an Edge operator that logs in and actually looks at the data in the Influx UI at the Edge itself. There's a bunch of ways to get data in. The most common is with the Influx Agent telegraf, which is an open-source agent. In this case, we're actually obviously talking about the Losant Agent, right. So, this is just another way of getting data into the platform using the right API. The Losant Agent is part of a larger category of custom apps/UIs that can both write data to and query data from InfluxDB through its API. There are other integrations that are there out there. So, if you have devices and that are that send data or subscribe to data from MQTT brokers, there are certain brokers that have syncs to InfluxDB built in or you can use telegraf to retrieve that data and write it to Influx. Telegraf will also consume from OPC servers if you have data like that and many more. And then if you're familiar with Grafana, that's a very popular open source dashboarding tool, very tight integration with InfluxDB. You can use that as well and of course again, the Influx UI itself. Continuing on though, this is just the last point here to kind of wrap it up. Influx is, while it does run at the Edge and it can do a lot with very little, it's really the best in class at writing time series data very, very fast. So, you can have very high precision data written to Influx and with it being high volume data, it does very, very fast seeking to talk to specific time ranges that you want and then very fast computation over time for any given series or multiple series. It also makes data immediately available for query. So, while Influx is indexing and putting the data where it needs to go, it's immediately available for your dashboard or your alerting system in a write buffer. And then it has great compression as well as down sampling capabilities to make storage footprints smaller and it is offered as a distributed and highly available cluster as well if you want that at the Edge. That about wraps it up for me. I will pass it over to you, Heath and I will stop sharing.
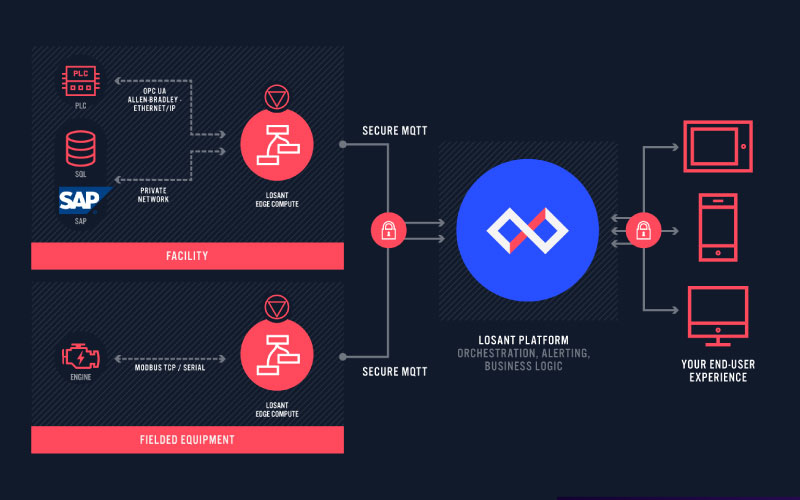
Heath Blandford: All right. Really appreciate that overview, Sam. It's always great to hear from people who are also in the same space kind of talk about their own product. I garnered a lot from that so again, I really appreciate that. Hi, everyone. My name is Heath. As Kevin said, I’m an Customer Success Engineer here at Losant. Today, as you can see if you haven't heard, we're going to talk about visualizing data at the Edge with InfluxDB and Losant. Here is what we're going to go over. We are going to set up InfluxDB, we're going to send data to that InfluxDB container. We're going to build and access an InfluxDB dashboard, then we're going to talk about querying data from InfluxDB. One of the use cases that you have here is to store time series data at the Edge and then use our Edge Agent to query that data and then operate on that data and then we'll wrap up and talk about some data retention concerns. Here kind of is an overall walkthrough of the process. This is kind of what Kevin touched on a little earlier. You've got some devices here that are not connecting to the internet. They are communicating over MODBUS, OPC UA, MQTT and they're sending data to the Losant Edge Agent or the Edge Agent is initiating that data read. And then locally, we are communicating over HTTP to the InfluxDB container and we're also serving a local dashboard. And then of course, if your gateway is connected to the internet, you have the option to send MQTT messages up to the Losant broker and then be able to orchestrate and have some more business logic on your data. As an example, as I’m walking through this demo, here's kind of the setup that I’m working with. I have a device that is communicating over MODBUS RTU with my Losant Edge compute device and then I’m communicating again, over HTTP to my InfluxDB and I’m serving a local dashboard. For this setup, we already do have... We have a few assumptions just for the sake of time here. We assume that... Not we. I already have a Losant Edge Agent up and running and I have an Influx container already up and running. Now, I have only started the container. I haven't done anything else. Here is my terminal. I’m SSH'd already into my gateway. So, if I run Docker PS here, you can see that I have both Influx and the Edge Agent running. Okay. I think it's time for us to get started. Here is my Losant application. Kevin, Sam, if this is too small, so too hard to read, please let me know. I’m happy to zoom in. Okay. Here's my application. I have a singular motor gateway device. Our workflow is actually just going to be reporting these metrics that we're recording as itself. What it's reading, and you can see over here on the right, is some information about a motor that I have — its current draw, its internal air temperature, the current RPM and the current voltage. We can actually take a look at that workflow here, read MODBUS data. This is just a very simple Losant workflow, Edge workflow that on a timer every minute, we're going and initiating a MODBUS read to a specific RTU connection and then currently, I have this set to report device state to the Losant Cloud application. Now, let's go ahead and get started with the InfluxDB setup in the InfluxDB UI. In a new tab, I’m actually going to go to the IP address of my device and that's on port 8086. When you run the InfluxDB container, you'll have to publish a port. The default port for that is 8086. Here is the getting started page. So, we'll just click Get Started. This initial user that you set up is the administrator for the InfluxDB instance that you're setting up. So, just make it easy here. My name is Heath. I can't type. Heath. We'll make the password easy for now. This is not secure. Password is just Heath123. The initial organization name and initial bucket name are things that you just set up initially. You can certainly use them as your data store and you also have the option to create new organizations and new buckets. My initial organization, we're just going to call this Losant-Example and my initial bucket, since this is where my time series data is going to live, right, that's where the bucket is the container, for lack of a better term, for all my all my data here. Since I’m measuring motor data, I will actually just call this motor-data and I’ll click Continue down here in the middle. All right, lots of stuff going on here, lots of pop-ups. Now, we're ready to go. InfluxDB UI gives you a lot of options to quick start some things, start collecting metrics about the container that it's in or the device that it's on or we can set up some other some telegraf plugins that Sam talked about. But we're going to skip those options and we're going to go right to Configure Later over here on the right. We're in. This is the InfluxDB UI that you see once you first get your InfluxDB set up. First thing's first, what I need to do here is get an authorization token. HTTP requests made between the containers here are authenticated requests. We'll go to the data tab here on the left. I kind of clicked that stealthily. I apologize. And then we'll go to tokens here in the top menu nav. When you create that administrator for this database, that person gets a token, that account gets a token but that token is a unlimited power token. You can delete Edit resources. The token that we want to create is just a read only token, a read and write only token. In the top right, we'll click Generate Token. We want a Read/Write token not an All-access. One of the cool things about InfluxDB right out of the box is you get bucket scoping. We want this token just to be able to read and write to the bucket that we created. We'll click motor data to read and motor data to write. We'll click save and probably should have given this a description but click that new token that we just created. We'll click copy clipboard and now, we're ready to get things set up in our Losant application. I’m back in my Losant application here just in a new tab. What I’m going to do is add an HTTP node. I’m going to select these. Oh, I’ve selected too many. Select my debug and device state, create some room for myself. I want HTTP. We'll drag and drop right there. Pro tip, if you didn't know, you can actually drag and drop nodes onto the lines. When they turn dotted, you can drop them and they'll be connected immediately. But I don't need that one so I’ll get rid of it and I’ll reconnect. There is quite a bit of setup that we need to go into when we talk about the HTTP configuration. It's actually where most of our conversation will be around. We're actually going to make a post request. Before I forget, I’m going to go down to request headers. Remember, I have that token copied on my clipboard. I’m going to type authorization. The way the token authorization works is we type token here with a space and then we can paste in that token that we have. Oh, I almost said backspace. That's not what I want to do. Now, we have that authorization in there. Now, we'll talk about the URL. I’m actually going to paste in a URL here but I’ll show you where I get this URL in just a second. Here is the URL that I’ll be writing to. There's a few parts that I want to talk about but first, this is just the InfluxDB API URL. You can see here, it has endpoints and descriptions of those endpoints. We have this api/v2/write. This workflow that we're working on is writing to data. So, we're going to api/v2/write. The URL base is InfluxDB 8086. So, port 8086. One cool thing about having two containers, two Docker containers on the same Docker network is you can make HTTP requests between those containers and Docker will take care of the domain name resolution based on the name of the container. If I actually go back to my terminal here, you can see on the right side here... Oh, I don't know what happened there. On the right side here, that I’ve got Influx name and Losant Edge Agent. That's just a cool little trick there. My URL here is just InfluxDB 8086. And then here, we've got some query parameters on the end. We're writing to a specific organization in a specific bucket. My initial organization name was lowercase "l" and a lowercase "e." We're not writing to the bucket environmental data. We created a bucket called motor-data. Motor-data. And then for our body, the body of this request, the data that we're sending is what Influx refers to as line protocol and it's right from their documentation. Line protocol is a text format for writing points of data into the database. You can see here about the syntax where we're talking about the measurement name, a tag_set and the field_set of the data that we're sending in. If I go back to my workflow here, I’m actually going to again, copy something in and I’ll paste it in but we're going to talk about each part. It's long, it's a little scary but we'll talk through it. We've got device ID here at the beginning or device at the very beginning. Just like you saw in the documentation, this is just the name of the measurement. We're measuring the device but really, what I want to call this is motor. We're measuring our motor, that's what I want to name this method, I think. We're not actually sending data for a peripheral right now. We're actually having this workflow report state on behalf of itself for our gateway. So, we really just want to make this device ID. That is our tag set. That is how we're tagging this data in InfluxDB. And then we have a whole set of fieldsets, a few fieldsets here. We have temp where we're sending the temperature of the motor as a path on our payload. If you're familiar with building workflows in Losant, we're just sending values that are on our payload. We're sending that internal temperature, we're sending that current, we're sending the RPM and we're seeing the voltage. As these change or if you want to change this for yourself, you can actually just copy a different path from our payload for a different value and put it in here. I’ll click Update here. One last thing we need to set up is the content type. Actually, I believe the content type is going to be... Contents type is application, JSON. And then we can save that workflow and we can deploy that workflow. Now, I’m going to deploy this workflow right to my motor gateway. If I select this, my motor gateway and deploy version, you get this deployment scheduler happening here. Now that that's deployed successfully, we can take a live look. We can actually test this workflow from our live look modal. I can click this live virtual button and we can see internal air. We got a MODBUS read. Good. Oh, I actually forgot one thing. I’m going to click Make Changes up in the top right and I actually want to see the HTTP response. [Inaudible 00:30:59] working.res for now. We'll save and we'll deploy this new version and deploy version down here. We'll click Refresh just to make sure and we'll check the new live look. I can actually hit the virtual button again and we've got working.res. Our status code is 200. That's good. Means we're getting data into InfluxDB now. So, we have this device state, we can actually go back to our device. I’m clicking the Device List button here and I go to the motor gateway. And I click Recent Device States. You can see just a few seconds ago, we had this state go through. Now that we have data going into InfluxDB, let's go set up this dashboard that we've been talking about for so long. I’ll go back to my InfluxDB instance. Again, that's just the IP address of my machine on port 8086. So over here on the left navigation, we're going to go to Boards and we're going to create a new dashboard. We've got a lot of things going on here. Let's first name our dashboard since I didn't give a description for my token, at least give a description for this dashboard. We'll call it Motor Status. And then right under the name, I’ll click Add Cell. InfluxDB actually defaults to a line graph. And then down here at the bottom is kind of the query builder on how we're going to get that data from the InfluxDB and displaying it here on this line graph. We have our bucket, motor data and again, the motor measurement. For this line graph, you can see we have our field sets here. Really, for this one, I just like to see the relationship between temperature and RPM. We have this ID here which is the device ID that was sent along. So, the device ID of that gateway that that's running this workflow and I’ll select that. You can see here on the right, we've got a window period for aggregates. The default is every 10 seconds, Influx will aggregate that data for us by default to mean, so the average over the last 10 seconds but I’m only measuring data at one minute at a frequency of once every minute. I’m actually going to go with last here. I’ll click Submit. It's a little difficult to see but over here on the right side, we've got some data happening with... Yeah, we've got RPM and temperature going on there. We've built our first cell. We can click the green check mark on the top right. If you're familiar with making or making dashboards and visualizing data in Losant, their InfluxDB's dashboarding tools are very similar. You can change the size. You can move these around. I can even add a gauge block and for the same, we'll go to motor data, motor, but I just want to see the current voltage of that device. We'll pick Last again. I'll click Submit and I have a gauge. Drop it below. We'll make it a little smaller and put it right next to our line graph. Now, we have a dashboard. We have a workflow from Losant on an Edge device that is requesting data or initiating a MODBUS read. We're sending that data both to the Losant Cloud for other business logic, things like creating alerts, sending emails, other things that maybe we want to send that data to Google BigQuery for or our data warehouse to do some AI things with it, some other metrics and measurements. Now, what we really like to do is talk about querying data from InfluxDB on the Edge. We have this time store now, this time series store for data. It can be useful to then query that data out and on the Losant Edge Agent, operate on that data a bit. We'll go back to our application here. I’m going to go back to workflows from the left nav over here, workflows. I’ll scroll down to Edge workflows to query data from Influx. Now, this workflow, I just have built. I haven't deployed it yet so we'll walk through each part together. Very similarly, we have a virtual button. This is just a workflow that I want to run manually not something that I want to run on an interval and then I have an HTTP node. Again, a lot of this conversation is going to be around the HTTP configuration. Again, we're making a post request. And we're making the request to, if we go back to the InfluxDB data, we're making it to the API query endpoint. If we go here, I’ll paste in a URL again. Copy, so we'll get rid of example.com and we'll paste this in. Again, let's talk about each part. We have that domain resolution that Docker is taken care of for us, the api/v2/query endpoint and then again, we have a query parameter. We don't want Losant-Example as our org. We want we want lowercase losant-example which is a little different, same but different. I’m actually going to real quickly, save this workflow because the authentication for this request is the exact same as my last workflow. I’ll go back to my read MODBUS workflow, back to my HTTP node here. Here, I have this token, this whole thing. I’ll just command A to select all, control C and I can go back to my query workflow. I know I’m moving a little fast but I’m just navigating between two workflows here. Back in my HTTP node, my URL saved. That's good news. And then my request headers, just so I don't forget, we'll do Authorization and I can just paste that token in there right away. Other headers that we need for this request are Accept. The response that we'll get back from the InfluxDB container is actually CSV data, encoded CSV data. You can probably guess that because we have a CSV decode node there. We actually want to do application/CSV. We actually have a content type as well that is a little specific to Influx. We're sending Flux, a Flux query which I will explain here in just a sec but I want to get these in here so I don't forget them. Content type is going to be application/vnd.flux for vendor and then flux. Now, we have our headers set up. So let's talk about the body of this request. I will open this up and I’m going to paste something in here. What this is that I’ve just pasted in is InfluxDB's Flux query language. It's a language that is designed for specifically querying InfluxDB data. Let's walk through each part. If you remember in our write request, we actually were writing to a specific bucket but in this query request, we're just saying from this board. So, in our Flux query, we have to say from which bucket. Again, not environmental data. What we want is motor data, the name of that initial bucket that we set up. And then here on, the second line we have range. We're gathering, we're requesting, we're querying the last five minutes of data and we're filtering for the measurement name of device. We changed that, remember, to motor. So, we want the motor measurement. From that measurement, we're filtering for fields of RPM and temperature. So, remember that graph that we set up. And then we're filtering for the device ID of the device that we're sending. Again, this is that handlebar. There's no station, those mustache brackets that you see all over Losant. [Phonetic 00:39:44] The window is the window of time that we want each data point to be. For the last five minutes, we're going to get data points for every 30 seconds, so we should get 10 readings. And then for each of those windows, we're running the mean aggregation. I can click Update here. A fun fact before I actually show this working. If we go back into Influx and we're here on our dashboard. If I go to the configuration of this time series graph, and you know how we built this query here at the bottom. Right next to the submit button, if I click the script editor, you can see here that we get basically exactly what my Flux query is going to be. A cool thing is you can kind of build a cell here in the Influx UI for a dashboard and get a query written in Flux that you can use in HTTP requests. I’ve modified this a little bit. I’ve changed the range, I’ve changed the window and I’ve changed the aggregate method. Again, you can find these Flux details in Influx's documentation. We'll go back here. We want to store the response at working.httpRes. Our HTTP node for query is set up. The second part is CSV Decode. Like I said, the InfluxDB container will respond with CSV data, encoded CSV data. We can use a Losant node workflow node for decoding that CSV data and it is delimited by a comma. We can save this workflow. We can deploy that workflow right to our motor gateway, deploy version. Before I go and test this... You can see we're deploying, we're waiting on that refresh. We can go to live look and just like before, we have a workflow. We can click this virtual button. But before I try... Let's see, motor data, motor, RPM field. Everything looks good. We can actually click this virtual button and then working.HTTPRes. You can see our body here. Whoa. We did it again. Whoopsie-daisy. Sorry about that. In our debug panel here and working.HTTPRes body. You can see we've got some data here, result table field measurement. In our CSV decode node, we're placing that parsed data at working.parsed. So, we've got 10 items there. For each section, we've got RPM measurement and the value of what that RPM measurement is. That about wraps it up. One last thing I do want to talk about, it's very short, is data retention in your InfluxDB container. If I go back to my InfluxDB container here, we'll click submit on this, if I go to the data tab again over here, Data, and I go to buckets instead of tokens, you can see we've got some buckets that Influx created for us when we initialized this container we've got our bucket here, motor data. Right under the name, you can see that our retention is currently set to forever. When you create a bucket, you've got some data retention settings that you can set that up. Currently, what's happening is all the data that ever gets sent to that bucket, that bucket's going to hold on to forever. What we want to do is set that up so we're not using all of our disk space on our gateway. From here, I can actually go to settings for this specific bucket. As soon as I click this open, you can see edit bucket. You can edit the name. Editing the name does have some implications specifically around writing and querying to the specific bucket. But we want to change the delete data. This is our data retention policy. We want to delete data older than, for this case, seven days. I only care about the last seven days of data on the Edge. Now, what you can do again like you saw me doing, is actually simultaneously sending data to the Cloud, to the Losant platform where you have some different data retention policies. We'll save changes and now that does it. Kevin, back to you for Q&A.
Kevin Niemiller: All right. Thank you, Heath. Thank you to both Sam and Heath actually for doing a great job walking us through this Edge offering. We have a couple questions that have come in through the chat that we'll get to after two final notes. If you have any questions that pop in your head, please make sure to put them in the Q&A section of Zoom. First, I want to mention an upcoming Losant Deeper Dive Webinar. On September 28th, our very own Director of Product, Dylan Schuster, will go over building performant workflows that scale with your IoT solution. Dylan will be providing best practices for developing workflows that scale as your business grows and how to improve the performance and scalability of existing workflows. Finally, I want to mention a couple great resources that we provide to help you build your IoT product on the Losant platform. Losant University is a great place to get started and our thorough documentation and active forums are fantastic tools to help. For reference on applications we have built, check out replays of our past Deeper Dives and if you are ready to start building, try out one of our hands-on tutorials. The hands-on tutorials will walk you through building different parts of your IoT solution or IoT product such as reporting device state over MQTT or configuring single sign-on all the way to building an end-user experience. There is also a how-to guide on the material that Heath went over today to walk you through using both the Losant Edge Agent and InfluxDB together at the Edge. Now, let's get into some questions. Okay, Heath, I think I’m going to throw this first one to you. This is great in sense that if I’m running my gateway on site in my customer's own environment and if I lose internet connection, then I will continue to store this data to InfluxDB at the Edge and the local dashboard will continue to work. If I am also saving this data to the Losant platform, what happens to the data I am pushing to Losant if I lose internet connectivity? Do I lose that data?
Heath Blandford: You actually do not. Certainly, it depends on how frequently you're sending data up to the Cloud and how you're sending that data up to the Cloud. If you're using our device state node or if you're reporting to an MQTT topic, basically, if you're using MQTT to send that data, the Edge Agent has this idea of MQTT message queueing. So, we queue up those messages if they can't send and then once you reconnect, there is a period of reconnect time where those messages will get sent. There is actually a limit to the number of messages that we can store. It's pretty big. I can find that number exactly for anybody who's looking for it. But the long and short of it is no, you don't lose that data and once your device reconnects, that data gets sent back up to the Cloud.
Kevin Niemiller: Sounds good. Thank you. Okay, Sam, I got one for you as well. You and Heath have done a great job providing this webinar and the how-to guide on Losant's website as great resources to get started with this Edge offering. This attendee wants to know if you can recommend any resources or services that Influx Data offers to help if they run into any issues or to ensure they're fully utilizing the InfluxDB product.
Sam Dillard: Yeah, sure. There's a few things, I guess they're kind of in tiers of intensity. Obviously, the documentation, we take pride in being very user friendly but for all community users, we do have a community website, community.influxdata.com and a Slack. Probably the Slack is better but there's a Slack group as well that you can sign up for and there's a ton of activity going on in there. You can ask questions in there, ask for best practices. We have developer advocates that monitor every day. Anything more than that, we do offer support subscriptions as well. If you are using InfluxDB in any capacity, you can sign up for an annual plan with support. It starts pretty low. So, you can get actual expertise and SLAs with regard to answering your questions and fixing issues for you.
Heath Blandford: Yeah. Real quick, I can actually attest to both the Slack community and the forums. While I was testing and building this demo and the how-to guide that we have in Losant's documentation, I asked a few questions just kind of as I hit roadblocks and I got responses and answers to my questions usually within an hour. My downtime was very limited and I really couldn't say enough about those communities.
Kevin Niemiller: Yeah, absolutely. There's a reason why we're doing this webinar. InfluxData has been great to work with and we definitely highly recommend them. This next question, I’ll go ahead and take. It's really more of a great observation than a question. Someone mentioned that it sounds like a great use case for keeping track of overall equipment effectiveness for a machine or manufacturing line and displaying the OEE on a local dashboard. So, Losant currently has a couple customers who are doing exactly that which is what got us started with InfluxDB. Let me talk about this a little bit more. I do want to first mention that we currently have a Losant OEE application template that provides a lot of the workflows to help you calculate that overall equipment effectiveness. There's also a Deeper Dive that goes over that application template. At the Edge, using the Losant Edge Agent with Edge workflows, we can pull data in from these machines, save it to InfluxDB and then on given intervals, query from InfluxDB to properly calculate that overall equipment effectiveness. Instead of sending all this raw data from the machine every couple of seconds or minutes, I can now send it once or a couple of times an hour to Losant platform to keep the end user experience updated. Finally, I just want to mention how powerful this offering is. With the Losant Edge Agent, you can build your Edge workflows in the Cloud like Heath showed, and then deploy those workflows to one or many gateways in the field at the click of a button. Once deployed, you can remotely troubleshoot these workflows that are interacting with your equipment and InfluxDB. Sam, I’ll go ahead and open up another question for you that we just got. How is InfluxDB compared to SQLite for the same type of purpose?
Sam Dillard: Yeah, that's a good question. I didn't touch on this so much. I didn't want to cover the concept of other types of databases just given the time I had but SQLite being a relational database, relational model, those kinds of databases, there's a lot of reasons but that fundamentally, those are better for OLTP workloads where you're doing kind of updates and things like that and relational types of queries. InfluxDB is built specifically for and is therefore, far better at dealing with OLAP style data access. So, you're doing longer form computation on more data. SQLite will store this data for you but when it's time for you to retrieve the data or obviously, to compress the data, SQLite's going to fall really short in a lot of ways. Basically, to boil it down, for time series specific workloads, any SQL like database is really not going to work for you at any kind of scale. It might work for you for like your home appliances but for scale, it's just not going to work.
Kevin Niemiller: Yeah, thank you, Sam. I’ll also add to that that InfluxDB comes with a great and easy way to start visualizing that data at the Edge with the dashboards that they have built in. I think we got through all of our questions. I’m going to go ahead and flip to this last slide. I just want to thank Heath, Sam and everyone that joined us today. If you would like to learn more, please check out InfluxData at influxdata.com/cloud. I know Sam also put a Slack channel in the chat. Please check out Losant by visiting the Losant website at losant.com or emailing us at hello@losant.com. Thank you again.