


Brandon Cannaday: Hello, everybody, and welcome to Losant's deeper dive webinar series. The deeper dive series is designed to provide an in-depth overview of some of Losant's functionality in order to give you a lot of information when it comes to building your own IoT applications on top of our platform. If you are new to Losant and looking for an overview or maybe a demo, feel free to reach out. We'd be more than happy to set that up for you. But I would recommend you stay on, because you're still going to learn a lot with this webinar. Speaking today is me. I'm Brandon Cannaday. I am the Chief Product Officer here at Losant. I'm going to be acting as emcee, or Taron Foxworth. He is our Education Lead and will presenting the majority of today's content. One of the major benefits when you join us live is that you do have access to some of Losant's foremost experts, and that includes Dylan Schuster today, who is our Lead UX Engineer. He has joined us to help answer your questions at the end of this webinar. Speaking of questions, I would recommend you use the Q&A feature in the Zoom webinar software. You'll find that button along the bottom of your screen somewhere. Feel free to put questions in there at any time during this presentation. I'll be watching those during Taron's content, and then we'll answer as many as possible at the end. This webinar is recorded. So, if you're unable to join us for the entire time or want to share this content with a colleague, we'll send that link to you after the webinar is over. You can also find this content on YouTube. Before we dig into it, I want to provide a brief overview of what Losant is. We are a cloud-based application enablement platform specifically designed for IoT. We provide that foundation and those building blocks on which our partners and customers build their own IoT applications. There's a lot of functionality that makes up Losant, but we divided it into these five main components, which we feel represent the complete technology stack that is required on the software side when developing an IoT application. That includes edge computing, your devices, and incoming data sources, the data visualization which includes dashboarding and batch analytics, our visual workflow engine, and finally, the end-user experiences. That's what's used when building and publishing your own completely custom and branded applications. Losant's a leader in the industrial and smart environment spaces, and we've offered this foundation for a number of customers ranging from start-ups all the way to Fortune 100s. So, if what you see today seems like it might work for your use case, please reach out, and we'd be happy to set up a much more in-depth conversation. While Losant provides the software foundation for IoT, there are many other components that have to come together. So, we surrounded ourselves with a wonderful ecosystem of partners. Includes technology partners that provide sensors, gateways, connectivity; better solutions partners that actually work directly with you to develop that application on top of our platform; and our strategic partners, where we have a very close relationship, and we share go-to-market and sales strategies. I would encourage everyone to explore our partner page and see if these partners do offer any products or services that you're looking for. Today's webinar is really going to cover application templates, and that is a feature that we have recently released that brings together all of the functionality that makes up Losant into reference implementations. We've done a lot of work to make sure we provide good documentation and educational material around each specific feature, but templates really provide you a good source of information on how to combine all of those features into something that's more real world. Templates provide that architectural guidance, implementation best practices. There are a lot of ways to develop similar implementation. So, our templates do guide you into some of those best practices. If you are building an application that looks a lot like one of our templates, feel free to use these as a starting point and extend it into the application with your own functionality. These are demo ready. So, many of these templates do come with built-in simulators. So, if you want to demo Losant in your organization or to your customers if you're a partner, you can start with these and show Losant's capability using one of these templates. Today's webinar is really going to talk about the huddle room application template. We developed this template because a lot of our customers have adopted the huddle room strategy. Huddle rooms are essentially non-booked conference rooms. Allows your employees to go find a quick spot to have an ad hoc meeting, but with that strategy came some issues. Our customers found their employees spending an enormous amount of time walking around looking for an available huddle room, and that caused a loss in productivity. So, this template and our customers, what they have started to utilize is occupancy trackers. So, understanding the real-time availability and historical utilization of conference rooms so that employees can immediately look at an employee app or maybe a kiosk within their space and see which rooms are available instead of wasting that time walking around. This template really does show a broader smart environment use case around utilization understanding. So, as Taron is walking through this, keep your imagination open that although this specifically applies to conference room, what else in your space could be tracked? Where is that benefit for understanding utilization within your environment? With that, I'm going to hand it over to Taron Foxworth who'll be walking you through the huddle room monitor template. Taron. Well, no problem. It looks like Taron is having a little bit of technical difficulty, but while he's getting back in, I'm going to go through some other use cases that we've seen in the smart environment. So, one is certainly the smart conference room and smart office space, and that's where we really talked about when it comes to the huddle room monitoring. So, adding sensors or retrofitting inexpensive sensors into existing spaces really gives you an in-depth understanding of what's going on within your own environment. The other one is entire buildings. So, you have conference rooms and floors. You can extend that to an entire building and see where assets and people might be moving around a space in a much larger area. Then finally, campuses. Smart environment is made up of more than just conference rooms and spaces. There are assets outside the environment, as well, including parking and sometimes even bicycles. Think about campuses that offer employee bicycles. Do you get the right bicycle? Do you have the right sizes? Where are they? Can employees access those assets within the broader campus itself? So, while Taron is still joining—it looks like he's having some technical challenges—I'm going to go through the more architecture of a smart environment. So, I mentioned a little bit about retrofits into existing spaces. This is a really common implementation approach that our customers take. It can be very costly to build out an entire new space. So, a lot of people just want to retrofit the space that they have. That's that top area, the top section on the left that you see. Something like Aeotec multisensor is a very expensive battery power option, but there are a lot of Z-Wave or Zigbee powered sensors that you can find off the shelf and install in your office space. Each one of those do talk to a local gateway. Z-Wave, Zigbee, Bluetooth, they're unable to talk directly to the Internet. So, they're going to talk to some kind of local gateway. Again, these are all available off the shelf, and you can find these and install these into your own space fairly easily. Those gateways then talk to the Losant platform. So, those gateways provide that bridge between the local environment and the cloud infrastructure. Usually, we see that over MQTT or HTTP. Alternatively, there are a number of partners in our ecosystem and vendors of existing smart building technology that have the sensors and motion sensing built directly in. One example is Cree Lighting with their SmartCast technology. Cree Lighting does have motion sensors built almost on every light fixture through the SmartCast gateway. The Losant edge compute agent is able to access that information and bring that data into the Losant cloud. The Cree option is going to be a little bit more popular if you are in the middle of rebuilding an entire floor or space, maybe a renovation. So, think about existing vendors that might have technology available for you if you are doing a renovation. Looks like Taron might have been able to join us. So, Taron, are you there now?
Taron Foxworth: Yep. Are you able to hear me?
Brandon: I can. I will pass it off to you.
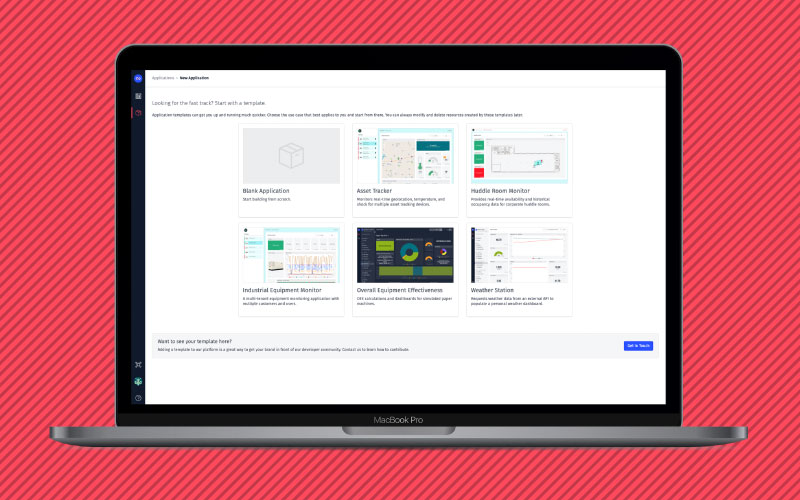
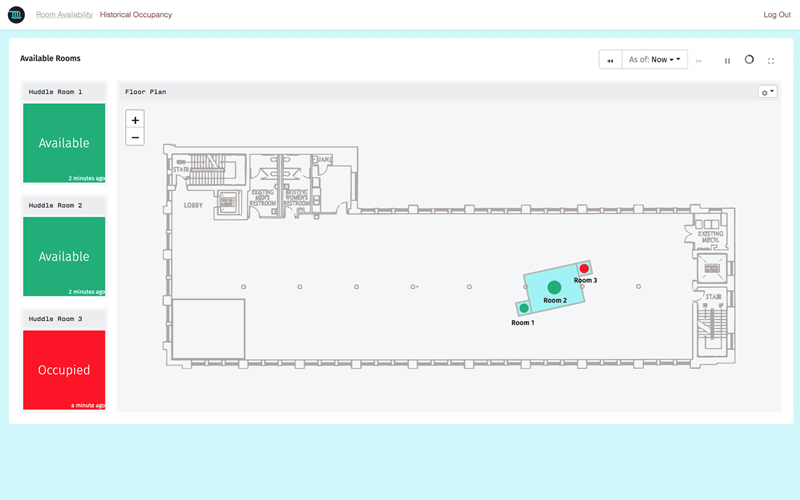
Taron: Awesome. Thank you very much. Sorry about that. Zoom was not on my side today, but I promise you all a great presentation. As Brandon mentioned, I'm going to talk about the huddle room monitor and help focus our attention just a little bit. I'm going to specifically talk about systems and experiences. Systems allow us to ask really good questions about groups of our devices. So, for example, Losant can, obviously, tell us if a motion sensor in a room is triggered or not, but systems allow us to see if motion sensors are triggered on maybe that floor that consists of rooms, or that building that consists of floors, or that campus that consists of buildings. So, we'll touch on that during this presentation. The other one is experiences. So, Losant was built for you to create your own IoT application, and this template shows a great example of experiences. So, these are the two things we're going to be diving into today. I think Brandon may have touched on some of these common use cases, but what I would like to add here is that this simply is a great starting point for these use cases. In the template you get this first step. It shows an example of monitoring three rooms, but in this case you can use Losant to track and control more and add other data sources. Obviously, that can expand into an entire smart building, which can lead to an entire smart campus that is also integrating things like maybe environmental data. So, the nice thing about Losant is you're able to build this application but also combine that with other data points you may want to collect for your application. Honestly, this is why we call it smart environment, because in all these use cases we're just extracting data from the physical environment and learning from it. Now, the whole point of the application template is that you all can easily start your applications from them. So, when you create a new application in Losant, here's the new application page. Here are the templates you're able to select from. The asset tracking and the industrial equipment monitor, they both have webinars available right now that you can go and watch. This webinar was done a couple weeks ago for both of these. So, those are there. Today we're going to be focused on the huddle room monitor. So, if you want to start from this for your application, you just add a new application, and you can start from here. That's exactly what I'm going to do. So, I'm creating a new application in my sandbox called Huddle Room Monitor. There's one thing to note, that all of these templates fit within the sandbox. So, they're easily available for you to play around with. Right now what's happening is that my application is being created from this template. Essentially, what that's doing is that's copying the template application directly into my Losant application. In this case now I have the Huddle Room Monitor. The one thing to note is that this comes with devices, dashboards, workflows. You get a bunch of resources with these templates already for you to go ahead and leverage. Also, the cool thing about it, you get prebuilt dashboards that you can now use, but there's one core thing about here that you see. There's no data. So, when you start from a template, one thing to keep in mind is that your application has no data yet, but as Brandon mentioned, each template comes with a simulator workflow. That's why we call these demo ready. In this case when you start a new application from a template, all your workflows are going to be disabled. So, the very first thing you want to go in and do is enable those workflows. In this case we can enable our workflows down here at the checkbox here and hit "update." Now in this case our application is running, and we have data coming in. What you see here if this is your first time in Losant, this is a workflow. This is a simulated workflow. I won't dig too deep into this during this presentation, but it's a really good example of how complex workflows can get. So, in this case this one is simulating if someone is in the room or not. It's even smart enough to track business hours, and it keeps people in the room for 15 to 90 minutes, which is an average time of a meeting. You can always go into your... Once you've copied the template, this workflow is yours. So, now you can change the simulating logic if you want or feed in real data, and that's what Brandon was touching on is how you actually get real data into your use case like this. The top one is the Aeotec multisensor. That sensor can talk to a Z-Wave capable gateway, and that gateway can talk to Losant over MQTT or HTTP. On the other end Cree is one of our partners. Cree, they have a technology called the SmartCast technology. Their commercial lights talk to their SmartCast technology which can talk directly to Losant edge compute and send that data to Losant over MQTT. These are both great examples of hardware that you could use for an application like this. Now what I want to do is switch to a completed version of my huddle room. In this case we just started it with simulating data. What I have is Fox's Huddle Room Monitor. So, this is an application I created from the template a couple days ago to get ready for this presentation. So, now I'm going to use this, since it has data, and there's a lot more to show. I'm going to use this as a way to show you the systems that we're talking about and to show you experiences that we were talking about. The one thing to keep in mind with all the read-me's is once you start from a read-me within your application... Sorry. Once you start from a template, you get a read-me. This read-me is right on your application overview page. It's just telling you everything you need to know about the template, its key component, where the simulator workflow is, how the simulation actually works. So, here you can dive deeper into exactly what the simulation workflow is doing and, most importantly, because this template comes with an experience, we can see the usernames and passwords for the users of that experience. Experience users are a little bit different from Losant users. Losant users are the users you build in your application; experience users are the ones using your experience. Now that we can see the username and password here, let's look at this experience and see what it looks like, and then we're going to dive into this application. So, to view the experience of this template we're going to go to Edit over here in the experience section of the application menu, and then we're going to go to the URL you see here in the top right. Once you go to that URL, you'll be presented with a log in page. Like I mentioned, these users, they exist within their experience, and these are the customers or the users of your application. In regards to the Huddle Room Monitor template, these are employees. So, here I can type in my employee credentials and sign in. Looks like I got those wrong the first time. Second time's the charm. All right, that's great. So, what you get with this template is what you see here. This is our experience. So, this is the application that's built on top of all the tools you see in Losant. Here is a Losant dashboard. In this case our application has three devices—so, Huddle Room 1, Huddle Room 2, Huddle Room 3—each tracking available/not available in the rooms you see here on the map. What's cool about this is that these are our handy indicator blocks. You could use these to show status of devices like you see here. This block that you see is our image overlay block. It's a really nice block, because the background is an image, and then what you could do is overlay shapes and colors of shapes on top of that. This is a very simple example of the image overlay block, but I love this image in the docs that show the full capabilities of where something like that can go. You can add text, other shapes. Your image overlay blocks can get pretty cool. It's also very common to use this for SCADA-like diagrams for industrial use cases. The one thing to know is when I logged in, I logged in as an employee. The cool thing about this template is that it shows a great example of what user roles would look like in experiences. In this case I can log in as a manager, and now we get something new. So, now that I'm the manager of this application, we see this new link called Historical Occupancy. The idea and the concept behind this is that as an employee what I'm really worried about is ME's there a room available, like Brandon mentioned. I'm trying to not walk around wasting time finding a room. So, this is really the only dashboard that I care about. But as a manager I'm interested in a slightly different dataset. I'm interested in the history of the huddle rooms. I want to see are they being used. Are there any days when they're not being used or they're not being used at all? Can we repurpose that space for something greater? So, this data can tell us a nice story about our space. All of this data comes from just what you see, the I have occupancy/I don't have occupancy. So, we can learn a lot just from a simple dataset. In the beginning I mentioned we were going to talk about two main things: systems and experiences. To show you how this experience works, the very first thing we're going to do is we're going to dig into some systems. Here's my Losant application. What I'm going to do now is I'm going to start with the devices. This application has five devices. On the dashboard that you saw, you saw Huddle Room 1, Huddle Room 2, and Huddle Room 3. If we look at those devices, they are standalone devices within Losant. A standalone device within Losant simply means that these devices connect directly to the cloud. There's other types to support other models like systems, for example. We'll talk about that here soon. This device is pretty simple. It has two attributes, occupied, which is a number. So, it can be simply 1 or 0. This is the data that's coming from the Aeotec multisensor or the Cree light, the edge agent. Also, we snuck in an extra attribute on these called meeting_time. The meeting_time is here to represent how long this meeting was for. The nice thing is because we have when the room was occupied and when the room wasn't in our workflow engine, you could actually calculate the duration of the meeting using that data. Again, like I mentioned, simple 0/1 data can actually tell you a lot about space. But those are our huddle room sensors. In our application you saw two extra devices. There's one thing to keep in mind about these extra devices. They are of type system. So, let's dig into that one. I'm going to dig into the Floor. The one thing you may think about is in my application if the data gets reported to the huddle room devices, how will we actually start to ask questions like how many devices are on this floor? That's where systems really come in. So, in this case when you're configuring a device, you can select System as the device class. What this would do is make this device a system device. So, system devices are normal, regular devices. What's different is how the data gets reported to systems. The cool thing about systems, we like to think of them as like a digital [Inaudible 00:24:36] feature. You could use them to develop and use this hierarchy of your devices. In this case this hierarchy is all about the data. Let me explain. We have our huddle room devices, and they have two attributes: occupied and meeting_time. What we really want for our application is to be able to ask different questions like how many rooms are available on this floor? Here we can create a system. The system has two attributes: occupied_rooms and total_rooms. These attributes are calculated from its children devices. In this case the children devices are the devices that you see here, the devices to the right. The cool thing about systems is that systems can actually have parents, too. So, in this case we can have a building, and this building consists of floors. This floor consists of huddle rooms. This is how we can begin to create our hierarchy within our application. Now, how does the data get from the huddle room device to the floor device? In our handy-dandy docs, here's an image that I really love, because it explains how the data propagates from the children devices all the way up to the parent very well. In this case we can see the devices on the right here can represent our huddle room devices. In this case each of them report a state, 0 and 1, just like our devices. If we take a look and we segment our devices here, we can see that three of these devices are 1, and over here this would be our floor. Our floor in this case would be 3. What we're doing here, we're configuring up for all these chosen devices let's sum up all of the attribute data. Then we can use that as the attribute value for the system. This allows for a very flexible way to start to answer these questions. In this case now we could say is there someone in this huddle room? How many rooms are occupied on this floor, and how many rooms are occupied in this building? The data from your system devices—so, the two rows here—are all inherited from their children devices. So, very flexible, very powerful model. What I'm going to do is go back to my system device. So, here, since we were looking at the floor, we can go back and dig into that. As I mentioned, the data behind systems are special. So, how do we configure that data? The first and most important configuration is the report interval. As you saw the diagram in the docs, that calculation of the system data, it doesn't happen in real-time; it happens on an interval. You can configure that interval here within the application. You can configure small intervals for more real-time devices. So, in this case I have it at five seconds. So, my dashboard that I'm showing you the data for those systems come back really quickly. Or you can have that be longer. This will report on a fewer basis, but also it will save a ton of payload. So, for example, if you're calculating this report for every five seconds, this device is reporting every five seconds. Instead, if you do every 60 minutes, this device is now reporting every 60 minutes. So, this is a good way for you to control what the interval is and [Inaudible 00:28:22] your application. Another pro tip is if you would like to report on a consistent interval, even if data doesn't change, you can do so here. What this means is you can choose to report duplicate values. Just to explain a little bit, in this diagram our floor has three open huddle rooms. The next time this reports you can decide to report that as a state value or not report it at all, and that's what that flag is doing. If you do decide to report the duplicate values keep in mind this will generate a bunch of payload, because it will report every single five seconds despite the fact even if the data changes. Now, looking at the attributes our huddle room devices had occupied and meeting_time. In this case we want our floors to have the number of occupied rooms. So, here is our attribute. We called it occupied_rooms. As you can see, its data type is a number. Here's the one thing that's special about system attributes, though. We can configure their attribute calculation. In this case it's an aggregation of sum. We want to sum up that occupancy of all the children devices that we saw earlier. Here we can specify what those attributes are that we're summing up. So, in this case you want to sum up the occupied attributes of all of our children devices. When you configure your system, you're configuring the sum of occupied of all your children devices, and it will be recalculated every query interval, so, in this case five seconds. In my recent device states, which is a very helpful log to see when your devices are importing data, you can see my application reporting occupied_rooms. This is Losant calculating these values for me. Lucky for us, extending a system is pretty easy. In the production application what you really want is a device recipe. So, you would create a device recipe for your building; you would create a device recipe for your floors; and you would create a device recipe for your huddle rooms. I am just going to clone my devices in this case to show you how we can add a whole new entire building to the application. So, in this case I'm going to clone Building A, and let's call that Building B. Then I'm going to save. Back to my devices. Now we have a Building B, and it's a system. Now I can clone a Floor. We're going to call this Floor 2. Actually, let's use 8. Then we can save. But before we save, now we can save this new floor. Its parent is Building B. We're creating that relationship between floor to building. Now, as you may think, we need to create that relationship between the huddle room and the floor. Now we have our new floor, Floor 8. We can create a new huddle room device, and we can call that Huddle Room 4. Now we can say its parent is Floor 8. Then save. We go back to our device list. We can check out our System Explorer here at the top right. Now, just like that, my single building application is now a campus. Extending the system to building this hierarchy is very easy and allows you to answer some pretty powerful questions about your data. One thing to note is that in our dashboards that you saw we weren't utilizing any of the system data. What I want to show you is two things. One, how to extend a template, meaning that now that we have this template, I've already extended it to support another building, but how do I extend maybe even the dashboard? In this case we can extend the dashboard and get a great example of how to display system data. In this case I'm going to go to my dashboard. I'm going to add some blocks to our History dashboard, because I think this data's going to be really important for the manager view of this application. So, in this case this is the dashboard that you see in that manager view within that experience; we're just looking at it from within our Losant application. I'm going to add a new block to this application, the gauge block. The gauge block is super wonderful, because it allows us to show a single value. In this case we want to show the number of occupied rooms in Building A. This graph will be a historical block, and it's a type number, but if we go here, we can say, "Here's my last received data point," and now we configure our device. So, let's say Building A. Let's select Building A. Since Building A has attributes, we can use occupied_rooms. So, right now there is only one room that's occupied. The nice thing is that we can go and verify that this works. So, if I go to my huddle room application and select the room availability, there's only one room that's occupied. That value that you see is not coming from this huddle room device; it's coming from the building device, which is calculated from those children devices. Now that I have that with my dashboard, the nice thing as you're building dashboards one thing to keep in mind, you can clone these blocks. So, since I'm showing the building here, the next block I can show is the floor. But instead of building that all over again, I'm just going to clone it. Exact identical. Now we can hop into this block and change its settings. So, in this case let's do number of occupied and floor 7. Then we go to our device. Floor 7. There's one occupied room. Keep in mind this number... Now, currently, since there's only floor and one building, they'll both be the same number, but this is also being calculated based off of its children. Let's save this block. Now, looking at this dashboard using systems we can dig into an individual huddle room. So, this is the huddle room device. Now we can start to enter larger questions of our application: the number of occupied rooms in the floor or the number of occupied rooms in the building. So, things can get pretty advanced here and pretty powerful. I really love this systems feature. The next thing I promised you I would dig in is experiences. So, let's jump into that. Here is the experience overview page. The one thing to keep in mind here is there is three sources I want to point out to you for experience. One, we're doing a deep dive webinar on experiences here soon. If you head to the website or search "deep dive" on Losant, you can register for those new webinars. The next up and coming one is about experiences, and it's actually done by Dylan, who is our QA person on the phone today. It's going to be great. You don't want to miss it. So, if anything around here that I'm talking about is interesting, be sure to come to that webinar, as well. There's also a Losant University course on experiences, too, if you want to dive in. But looking at our experience, this is the experience. This is it. We had the two links and what we saw was that when our employee logged in, [Inaudible 00:37:25] room availability was there. When the manager logged in, we got both links. Let's dig into exactly where this logic is coming from that controls these two links you see here. The very first question you want to ask yourself is when you're thinking about these links and where they are in this application. If we navigate between pages, notice that these two links are still there at the top. That's because this, what you see here, this is the page content. This content is changing when we navigate the page. The content at the top, the content that you see here, this is our layout and the background, as well. Layouts help us reuse common styling across pages, if you're unfamiliar with that concept. In Losant we have that baked right in. Here is our layout. So, if we go to our layout—ours is called layout-dashboard—we can see the HTML, CSS, and JavaScript that powers the layout. So, the one thing to keep in mind is that experiences are built with HTML, CSS, and JavaScript. Now, you're able to use Losant components like the dashboard, but it is your own application on top of Losant. So, those applications are typically web applications. So, they do require some knowledge of HTML, but it's really easy to hop in here and start creating the experience that you want. This, what you're looking at here, is an experience page. Experience page has handlebars templating built right in. So, here we're able to template in a component. In this case this component is some extra CSS for this experience. The nice thing about handlebar templating is that it allows you to capsulate code and components or a conditional. So, in this case we can say, "If the route of this request is equal to history, here's my title or else here's my title." Handlebars can get pretty complex, and they can offer a lot of flexibility for your experience views. We also have other [Inaudible 00:39:40]. So, in this case it's a file helper. You can actually integrate the files you have in Losant files directly in your experiences. Here we're using this file just as an image, actually, as the logo image of this application. If we scroll down a little bit more you'll see what we've been looking for this entire time, this block. As we can see, it says equal. So, this is the equal helper. So, "If the experience.user.userTags.role equals manager, display this HTML code." This HTML you see here is the historical occupancy link that take us to our dashboard. Now we've got to answer the next question: where is this defined? It says userTags. So, let's check out this experience user. You can view the users and groups for your application by going to the application menu and clicking on Users & Groups. Now, here are all of our users and groups. So, in this case if we dig into the user, we can see that users have been emailed their own username and password, first name, last name. We can configure the groups, but in this case we're configuring what we need in our experience, this user tag. If you are familiar with Losant, you may be familiar with experience groups. Experience groups allow you to say, "All of the experience users in this group have access to a certain set of devices." That's device access, in a way. In this case roles are a little bit different. Roles typically define maybe changes in a UI like the presence of the link you saw here. So, because roles operate a little bit differently, you want to use a different mechanism for roles. In this case one of the best practices that we suggest is user tags. So, for my user within this application I have a user tag called role and then a value called employee. As you would imagine, if we go into our manager they have a role of manager. This now allows us to do what you saw in the layout and customize our experience based off of the user role. There's one thing about experiences that is probably the one thing that I think is the coolest feature ever. So, we talked about workflows, and our workflow was simulating data, but in this case the workflow that you see here, this is an experience workflow. I notice nothing's in my debug log. When we go to our experience and we refresh the page, what's happening behind the scenes is that you're triggering a workflow. This workflow is an experience workflow, and this offers you a pretty capable and flexible way to building your experiences. Then, as everything in Losant, you're able to integrate all these things together. So, in this case here's my history page. I'm going to click back to my experience. We can look at the URL. Notice it says "/history." Going back to our workflow, in this case now when that route is triggered, it will trigger this workflow. In this case we want only managers to be able to view that page. Since we know who the experience user is, because they're logged in... Pro tip: when an experience user is logged in, and you're building an experience workflow, you will always be able to reference user@experience.user on your payload. So, in this case we can check experience.user.userTags.role, and we can ensure that it is a manager. So, what this is doing is... Think of this workflow as the back end of that application. So, on the back end of this application we're actually verifying that this user is a manager, as well. This could be expanded and used in all sorts of ways. If they are a manager, we want to reply with an experience page. In this case our page is called page-dashboard-history. Let's take a look at that. To view your pages, go to Edit and page-dashboard-history. So, this is the page. So, when you make that history route, it checks in the workflow if you're a manager, and then it returns this page. The one thing to note about this page, here's where our layout is referenced. So, what this page is saying is, "I want to use this layout, and in my page section of that layout I want to have this dashboard." This is the Occupancy History dashboard, the one that we were just editing, actually. So, in this case what's happening is that when you load this page, a workflow is being triggered. That workflow checks to see if it's a manager or not. If it is a manager, it renders this page with the layout that you see here with the two links above and then this dashboard as the page content. So, that's actually how the data is getting from what you have in Losant all the way here to what you see as a user. I want to leave you with one pro tip. So, here as we're building our experiences, the one thing to keep in mind, the most helpful thing is the render log. So, if we go to our experience and we hit "refresh..." Since this is a live log, this page has to be open for you to view this. What this render log shows is everything that happened when you made the request to that page. So, in this case here are all the components that were involved in that page. The context of the data that was being passed into that page, you can view that here. So, in this case since we know that this user is logged in, since we logged in, we have experience.user, exactly the same from what we would expect in the workflow engine. Then we can also see the final markup that was created when this page was loaded. What you get from here is a foundation for a smart environment application that I hope you all can build upon. With that, I will turn it back to Brandon.
Brandon: All right. Thank you very much, Taron. So, we've got a number of questions already coming in. As we do a little bit of wrap-up we're going to use the rest of the hour for those questions. So, if anything pops into your head, please make sure to put those in the Q&A section within the webinar software so we can get to those in just a moment. If you do start an application from a template check out those read-me's. They provide a lot of useful information about how that specific template works. We do have two other webinars already recorded. Replays are available for the industrial equipment monitor and the asset tracker templates. They cover the in-depth details just like this one did. You can find those replays on the deeper dive page on Losant or on YouTube. So, from here the next step, if you want to explore this template and maybe use it as part of your own smart environment application, the first thing you're going to have to do is start defining the model that represents your device and find some hardware. So, these templates use simulated data, but in the real world they're going to be powered by some kind of hardware or sensors, and really, that's up to you and your specific use case. If you do need some help or guidance on hardware that seems to work, we've got a ton of experience with hardware that both works really well and hardware that has not proved to work very well. So, feel free to reach out. We can get hooked up to one of our solution engineers or solutions architects, and we can walk through some hardware choices that might fit your use case. Then once you've got some real data streaming in that matches the model of that device's attributes, you can start applying that to your version of the application. So, you can start from this template or use this template as inspiration or guidance for your own application. We've got a couple other webinars coming up. So, make sure to save the date for those. Taron did a brief dive into experiences in this webinar, but Dylan is going to lead a much more thorough overview of Losant experiences. Experiences are one of the more challenging parts of Losant for people that might be new to the platform. So, if you are using that functionality, this is a webinar I would really recommend. Taron is coming back in June to do a webinar to cover a lot of the learning and educational resources that Losant offers. There's a lot of ways within our ecosystem to learn how to use Losant. So, Taron is going to take a deep dive into many of those and help guide you when you're exploring building your own application. You can register for all of these at losant.com/deeperdive. If you are ready to get your hands dirty, we do offer a ton of learning material. So, our documentation is very thorough. We make sure no feature is released without being documented. We do have our forums. So, if you want to ask general how-to questions on building something in Losant, we would really recommend you go to the forums for that. We do have Losant University. So, University is an in-depth video-based training tool that guides you through almost all of the major components of Losant. It's a great way to get up to speed quickly, and we do also offer a certificate of completion. So, if you do make it all the way through Losant University and do pass the exam at the end, you can print yourself a certificate and, hopefully, hang it on your wall in your office. Then our blog has a large number of tutorials. So, if you are trying to solve a specific problem using some specific technology, go check out the blog. There might be a tutorial on there that is pretty close to what you're looking for. So, with that, we're going to open it up to some questions. So, first off, let me bring open some questions in chat and the Q&A. Let's start with some simple ones. So, Dylan, if you're still on, can you do a couple of questions about limits that came in? Is there a limit to the number of experience users? Then follow that up with: is there a limit to the number of levels that a system can have?
Dylan Schuster: Sure. Just start with the experience users. Yes, there is a limit. That limit is pretty low when it comes to a sandbox account. I think it's only two or three users, but that, of course, goes up when it comes to an organization. If you do find yourself building an experience or having an application experience out in the wild that is bumping up against that limit, you can, of course, reach out to your contact here at Losant, and we can talk about increasing that number to whatever it is that you need. Second question: is there a limit to the number of levels a system can have? There is a sanity limit, I will say. I don't know what it is off the top of my head. I want to say it's 100 levels deep. For all practical purposes, there's no real limit; it's just a matter of keeping the API from getting itself into an infinite loop with that number, that limit, on how deep the system can go.
Brandon: Awesome. Thank you. Taron, here's a perfect one for you. The template tracks essentially utilization, or maybe motion detects a presence of a person. Can you step through what it would take if you wanted to add temperature and humidity to those devices, which seem to be pretty common in a lot of the sensors that we find?
Taron: One hundred percent. You mind if I share my screen? So, as Brandon mentioned, and as we talked about in this diagram here, there are a ton of ways to get this data to Losant. So, the first thing that you want to do is figure a way to get the data. So, in this case, the Aeotec multisensor, that sensor actually tracks motion, humidity, and temperature. Has a bunch of data with it that you could actually use and leverage immediately, but the Cree Light is just a light and a motion sensor. So, step number one is going back to what Brandon mentioned, find hardware for a use case. So, you got to have the ability to track temperature. But once you do, and you're able to send that to Losant over MQTT or HTTP, integrating that to the template is pretty easy. We can create new devices to [Inaudible 00:53:06] temperature or we can extend a hardware device like the one you see here and add a new attribute. In this case, it would be temp or tempC to represent Fahrenheit. We can track those directly on our devices, as you see here. That would be how I would integrate temperature into the application.
Brandon: Awesome. So, here, pass that screen back to me, please.
Taron: Of course.
Brandon: All right. Then there is a great question on some deeper analytics. So, I'm going to answer this briefly, and then I'm going to ask Taron, can you bring up our Notebook example for the smart environment, and then I'll toss it to you to step through that. So, while you're bringing that up, I'll read the question and do a high-level answer. So, the question is: how can we pull the time series data into an ML training application for occupancy forecast and prediction? The use case is specifically for commercial buildings such as shopping malls. That is a great question. So, this really piggybacks on our batch analytics capability. So, I'm going to talk about that briefly while Taron is bringing up an example. So, within Losant there is a feature called Notebooks. Notebooks is 100% designed for that large scale batch processing of historical time series data. So, what you can do in there is if you've got all this occupancy data, we'll take care of pulling all that information out, placing it close to a Jupyter Notebook. We piggyback on Jupyter, a very common data science tool. Our Jupyter execution environment does have Google TensorFlow. So, you can use that to actually train an ML model. Combined with our workflow you can make that scheduled. So, maybe you want to retrain it weekly, or monthly, or what duration it would take an interval that makes sense based on a meaningful amount of new information. Then that model can be sent up to Google's cloud execution side, the ML engine, which our workflow does directly integrate with. So, we can do the real-time training and the real-time execution of that model entirely within Losant. So, Taron, do you have that example up? Maybe show a little bit of the Jupyter Notebooks?
Taron: Yep, sure can.
Brandon: Let me pass that back to you.
Taron: It's like hot potato. I love it. In this case, what Brandon was talking about here is the Notebook. This is the Losant Smart Office application. The application looks very similar to the one we just demoed in the template, but this one has a Notebook. As Brandon mentioned, Notebooks are for batch processing. I like to start my Losant learning with questions. So, the question to that Notebook answer is: if we want to look at data over a large amount of time and derive some sort of insight—so, the batch processing—the workflow engine is stream processing. So, as they're coming in, let's do something with it. Notebooks, on the other hand, are let's look back at data. That's what Brandon was talking about. So, when you're configuring Notebooks, you can configure your input. So, in this case, my input is simply my devices data. Brandon mentioned Notebooks are all backed by Jupyter. So, the entity that's performing the batch processing is a Jupyter Notebook. Every time a Notebook runs, we get this super clean execution log that tells us when and what happened and all of the outputs of the Notebook. So, if Notebooks are for batch processing, that batch processing has some sort of result. We can get those results back, integrate those into other dashboards, trigger other things. The nice thing is that we also see the Jupyter Notebook and what it looks like after it's done running. So, in this case, here's a Jupyter Notebook for this application. It's pretty simple. All it's doing is calculating how much motion is on each day. I think this one is answering the question what is the most popular day in the office, which is a really tough question to answer in a workflow engine but very easy once you have the tool that you're familiar within the data science world. Then Brandon mentioned all this is directly integrated into our workflow engine. So, in this case, we can trigger workflows when our Notebook is complete and use that result somewhere else, or we can tell from a workflow trigger a Notebook itself. You wouldn't actually connect these in practice but... That is how Notebooks work in Losant.
Brandon: All right, awesome. So, just a few seconds left. I think we've got time for one more question. It's poignant with the atmosphere we're in today. So, Dylan, maybe you can talk a little bit about how you might use an application like this to track some social distancing. So, can something like this be used to make sure no more than a certain number of people enter maybe a conference room, or could be a commercial space, or something like that. So, can you talk to some of the technology you might recommend when making sure no more than a certain number of people enter a space?
Dylan: It's a good question, a good topical question. It's going to depend on your hardware, of course. The occupancy sensors range dramatically as far as how granular data can get. So, at the bottom of the spectrum, it's just going to be a motion detector. If there's motion in the room, we can assume that at least one person is in there. We can't really tell much more than that as far as how many people would be in there. Of course, we also don't know the dimensions of the room. These sensors go all the way up to facial recognition and everywhere in between. Not so much this is Brandon, and Fox, and Dylan in the room, but there are three people in a room. Something like that we certainly could track. So, in the case of how you would set that up in Losant, assuming your hardware can at least tell us how many persons it is picking up, I imagine... Well, there's a few ways that you could do this. The device that is reporting this information would count how many people are in the room. You probably have established some sort of threshold given the size of the room. You could do anything from turn on a light on the wall if that's connected to the platform via a different device, a little sign that says, "Hey, too many people in here." You could send a text message to the building operator. You could log an event, which is a little less intrusive, and just come back and use it as a training mechanism later that we had too many people in the room from this time to that time. A whole lot you could do there.
[Crosstalk 01:00:02]
Dylan: Oh, go ahead.
Brandon: Oh, if you had more, please continue.
Dylan: I was just thinking out loud. There's also possibilities where... This came up in a conversation I had with somebody, actually, earlier today, where they could use camera sensors to determine whether or not somebody is wearing a mask. That, of course, comes back to how high quality the hardware is. But if you have an image on hand, you could also use the workflow engine to send up to a third-party service that does image recognition such as Google's Vision API, and perhaps that can deduce whether or not people are wearing masks. If it can detect a face without a mask, you could create the same alert that I mentioned as far as number of people within a room.
Brandon: Got you. No, some good insights. Thank you. That reaches us to the end of the hour, a little bit over. Once again, I want to thank everyone for taking time out to join us today. As one more reminder, there are two other webinars coming up in May and June. So, add those to your calendar. If we weren't able to get to your question, we do try to answer those offline. So, look for those in the forums if we're able to, and then look for a link to this replay that you can share with any colleague that wasn't able to join live. With that, I appreciate again you joining us. Thank you.