


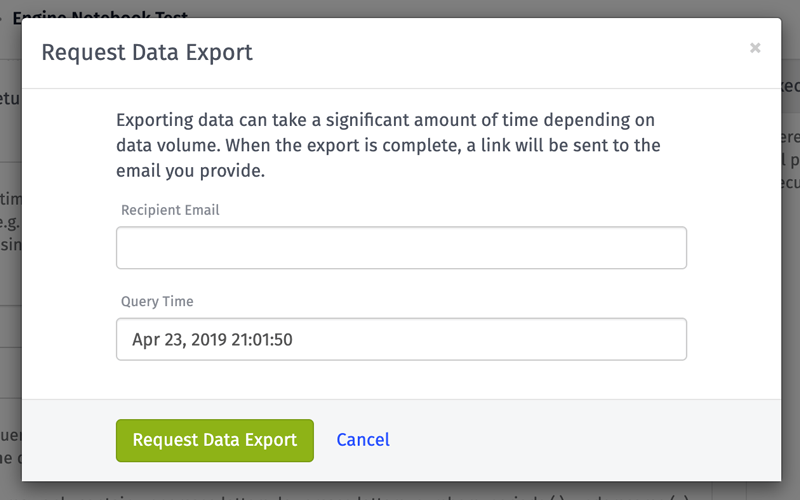


Brandon Cannaday: All right. We're going to go ahead and get started. Welcome, everybody, to Losant's deeper dive webinar series. This is the second of our platform deeper dives. We've got two different types of webinars that we do. One is for platform announcements, and one is for more solution-oriented walk-throughs. So, this is one we're going to do an overview of some new functionality that we call Losant Notebooks. So, joining us today you've got me. I'm Brandon Cannaday. I am the Chief Product Officer here at Losant, and we also have Anthony Canterbury. He's going to be joining us for Q&A at the end. He's our Lead Backend Engineer. He has a pretty good background in the data processing world and was one of the primary engineers that helped put this functionality together. So, hopefully, with our two heads combined, we'll be able to answer any questions that you may have. Speaking of questions, we're using the Zoom webinar platform. You'll see somewhere on your interface a small Q&A button. That will allow you to ask questions. We're going to hold all the Q&A until the very end, but don't let that stop you asking questions along the way. If we say something that isn't clear or a little confusing, please just drop a question into the box, and we'll go through this at the end. We're shooting for about 20 to 30 minutes of content, and we leave the rest of the hour open to Q&A. So if you need to head out, feel free to do that after the content, or if you'd like to stay around for the Q&A, you can do that, as well. So, before we dive in, just a quick reminder of what Losant is. We are an application enablement platform. Really, what that means is we provide the tools and the foundation on which our customers build, develop, publish, and take to market their new connect to IoT product. We divide our functionality into these five major components: edge compute, devices & data sources, data visualization. That's where we're going to be spending time today. We've brought our Notebooks, our stat Notebooks functionality into the data visualization component. We've got our visual workflow engine, and finally, the end-user experiences that publish everything out into the world. We've provided this foundation for a lot of customers, big and small across a large variety of industries. Our two primary industries are definitely industrial IoT, remote equipment monitoring, but also smart environments. So, I'm going to be going into a little bit of the smart environment use case today with our Notebooks, but that's where we play a lot. So, we have a lot of customers in those two segments, but there are a lot of use cases outside of those that we service, as well. So, let's get right into it. Losant Notebooks. This was released late last week, and this is some powerful new functionality for working with the data and IoT data that you're collecting inside your Losant applications. We define it as the fully integrated execution of Jupyter Notebooks against your application data. Let me switch my screen very quickly to bring up some information about Jupyter. So, if you're not familiar with Jupyter, it's a really popular, fairly commonly used data analytics tool. A lot of the data science and research groups. It's a very powerful interactive way to really work the data. It's got a huge ecosystem, a lot of contributed functionality, a lot of great libraries. It's probably one of the easiest tools out there to really get your hands dirty with the data, and that's why we adopted it. It has a very robust community behind it [Inaudible 00:03:49] really actively developed. So, this is the foundation for our Notebooks functionality. So, if you're not familiar with this tool, I would definitely recommend you go check it out, especially for how we've integrated this with the Losant data. It's going to be a really nice way to work with your information. So, the reason we brought Notebooks into Losant was because of the two types of processing that we really see most common in IoT. One is real-time stream processing, and really, that's what Losant has been suited for since the very beginning. All of your devices out in the wild, they're constantly reporting new information. Our real-time workflow engine can pick up that information in real-time, make some kind of decisions on it. Maybe that's an alert, a notification; maybe that's some command back down to the piece of equipment, and all that's done in real-time. Stream processing is a really important part of any IoT product, but as our customers started onboarding thousands or tens of thousands of fielded equipment, or equipment in a factory environment, or rooms in a smart environment, there we started to see the need of a new type of processing. We call that batch processing. I want to look at a large historical chunk of information that has been previously collected, and that will allow me to derive some new types of insights rather than just that data streaming in. Now, Losant's had some form of batch processing for awhile. If you use our dashboarding tools, any time you do an aggregation on our time series data or put a gauge block, that is a form of batch processing. We are looking at historical information, but it was really limited to the types of aggregations that were suited for that time-series data that we're collecting. The introduction of these Notebooks really does open up a lot of additional functionality for entirely new types of information that you can work with. Before we get too deep, I really want to set the stage appropriately for what we treat as Jupyter integration. There are a lot of hosted Jupyter Notebook environments in the world. This is just the first blog that I found because I just Googled "hosted Jupyter." That's not really what we provide. Hosted Jupyter environments are excellent tools for authoring and interactively working with Jupyter without having to install the runtime on your local computer. However, we thought it was better suited for our use cases to treat Jupyter more like scheduled jobs. That's because your IoT devices never stop reporting information. There's constantly new streams of information coming into this platform. So, we want to be able for you to provide this ongoing, recurring data pipeline, where we'll automatically query all that newly collected information; we'll automatically make that available to your Notebook; your Notebook can execute on that, provide outputs; and we'll take that and put it back into Losant for further business processes. All of that can be scheduled on a periodic interval—may be daily, weekly, monthly, whatever it happens to be for you—all inside Losant with our workflows. So, that'll be important to understand as we continue going through this walk-through and talking about how these things come together because we don't provide the interactive sessions that you might have seen on other cloud platforms. Those are great. You can use those to develop the Notebooks for Losant. We will take those Notebooks that you develop externally and then execute them within our environment directly with your data. So, we see a lot of great use cases for these Notebooks, especially in existing environments that start to collect a significant amount of information. Now, these Notebooks and authoring these Notebooks is typically going to be reserved for more of a technical team. I would recommend some kind of engineering background. You don't quite need to be a data scientist to pick these up and be very successful, but some kind of engineering background is probably going to be required in order to really make the full amount of use of these. So, within a smart environment, that's the one I'm really going to be digging into today. There's a lot of people, a lot of things, a lot of spaces, occupancy that you can track. You might want to understand your environment over its entire life or entire subset of its life to really figure out how your space is used. That kind of data crunching is suited really well to our Notebooks. The next is industrial equipment monitoring. You could have thousands or millions of fielded equipment into your customer's hand. You could have a bunch of equipment inside your plant floor all reporting large sets of historical information, and a great thing to do, great use case here is essentially failure correlations. All of this equipment is probably periodically reporting some kind of status codes or fault codes, and it's a really powerful insight if you can correlate that with external factors, maybe geographic location, weather, or some other indicators that might help you figure out why certain areas or certain subsets of your equipment have a higher failure rate than others. That's some complicated analytics that can be done with our Notebooks functionality. Then finally, predictive analytics. That is where a lot of industry is going, a lot of attention on that. You can do something as simple as [Inaudible 00:09:07]. That's basically think about financial projections. Based on my revenue growth, where am I going to be in two years all the way to really complicated things like machine learning and neural nets. Our Notebook environment does actually have [Inaudible 00:09:21] installed. So, if you're comfortable with that and you really want to get complicated, you can start training machine learning models directly in Losant on your historical data. So, with that, I am going to dive into the smart environment example. So, first, let's take a look at this dashboard. If you joined us in a previous deeper dive webinar—I believe it was our first webinar—you may recognize this. This is our own smart office, and we have motion sensors in all of our conference rooms on the seventh floor of our office here. That's the four rooms, a couple call centers, and the main conference room. So, on the previous webinar, you have seen these graphs already. That's done with the custom chart block that we have. It's a great way to basically create a visual representation of the most active times and most active hours of the day and day of week for each of these conference rooms, but this is just a visual representation. Getting something that's machine-readable, something that it can act on, something that it can use to programmatically control something else or make decisions on, that requires some additional capability that would have been very difficult to implement before Notebooks. So, what I've added is this table on the right. This is populated in a data table. A Notebook is doing that work. This is a list, a sorted list of the most popular days and times over the last seven days. So, it looks like Monday at 10 AM and Monday at 1 PM seem to be our most active times for that conference room. Now, this is machine-readable. I can now make decisions on this. So, this is the example I'm going to walkthrough. How did I build the Notebook, how did I get the data into that Notebook, and get these results from the Notebook back into Losant? So, to create a Notebook, there's really five steps. The first four steps are really setting up that data pipeline and then, that fifth step allows you to execute that over and over and over again with, really, little input from you but always on the most recent information collected from your data. The first is configure those inputs. What data do I need? Two and three are about developing that Notebook. I need to request a sample dataset. I need to build my Notebook and then provide that Notebook to Losant, and then I need to configure. My Notebook's going to create some kind of result, some kind of output. I need to tell Losant what to do with that. And then finally, I need to run this Notebook. So, let's dive into each of these very quickly, give you a really good sense of how these things come together within the Losant platform. The first, you'll notice there's a new menu item on the left in the sidebar for Notebooks. We put that under data visualization component. That's where you'll access this new functionality. I've gone ahead and opened one here. You'll see across the top these tabs follow those same five steps. You've got the inputs; you've got the Notebook file, where you upload that Notebook file you created; describing the outputs; and then finally, there's a way to manually execute the Notebook in the corner. You can also execute Notebooks programmatically using our workflow engine. So, let's dive into those inputs. There are a few different types of data that you can provide these Notebooks. Losant really takes care of all this for you. You can grab device data from one device, a family device. This is really heavily optimized for large datasets. So, if you've got 10,000 devices, and you want to crunch through a huge dataset, that's what this is used for. In my example, I just want that list from the front conference room, and I just want seven days of information. Then what you do when you query all data is you give it a filename. Where do I put this file next to your Notebook so when it executes, it'll be available? That's a lot of the surrounding logic that we put in place to make Notebooks easy to operationalize. In this case, the Notebook will have provided an environment variable. So, when you write the Notebook, you know if I look in the directory specified by that environment variable, I will see all of my input files. Losant will take care of downloading, extracting, querying, all of this information, and it will put it in that directory for you so when your Notebook executes, it'll be there waiting for you. So, again, query the devices you want, the time range of the information you want, and then what filename would you like us to place that next to your Notebook as? We also have device metadata. That's all of the names, descriptions, the tag values. If you do need that device metadata in order to make these complex aggregations or logic that you're building, you can query that, and we'll put that next to your Notebook, as well. You can also query data tables. So, if you've got some information that's not on a device—maybe it's in a data table—you can query that, and we'll put that on disk for you, as well. Then, finally, external URL. If you just happen to have a publicly accessible dataset that you'd like to pull in from some other source—that could also be Losant files—you could provide a URL pointing back to a Losant file. We'll pull that in for you, as well. So, the inputs is all about describing to Losant every time this Notebook executes, what information do I need to pull together, extract, and query, and then lay down next to that Notebook so when it does execute, it'll all be there waiting for you. If we move on to the next thing we need to do. Two and three are all about building that Notebook. So, again, we don't have the interactive session. We're not an authoring environment. There's a lot of those out there available for you, or you can just run Jupyter locally, but what you need to do is once you describe those inputs is request a data export, and that'll essentially take a snapshot of all this information. That's a great example dataset that you can use to develop your Notebook on top of. So, if I click that button, this could take a while. You could be querying a significant amount of data. Although a lot of work has gone in our backend infrastructure to optimize how fast we can get data out of our data warehouse, this still could take a while. So, it's going to go ahead and email you some links when that's done. There's also this concept of a query time. Query time really lets us change that anchor in time at which data is queried from. So, if I go... I've got a visual here to help describe that. By default, query time is always just now. So, when I requested the last seven days of information, I'm going to start it now, and I'm going to look seven days into the past. However, I could change that query time so that seven days in the past basically ends at some other time important to me. This is really useful if you want to line up your data queries on known boundaries. So, if I ran this today, I'm going to get... Let me go back here. I'm going to get seven days of information, the seven days prior to 1:18 PM. Maybe I want to move that back and say, "Well, I want Sunday to Sunday starting midnight to midnight." So, I could change the query time to yesterday at midnight, and it lets me line up that seven days on known boundaries. For here I'm just going to leave it now, and I'm going to get the most recent seven days of information. So, once you click "request data export," our backend infrastructure is going to start doing its work, and you're going to get an email that looks just like this. Since I've got the one input, I'm going to get an email letting me download that one file. Now that I've got an example dataset, I can start getting to work. You can also use this as a general data exporting tool. So, you don't necessarily need to develop a Notebook on this. This is a very good way to query large amounts of information out of Losant if you need to extract it and use it for other purposes. So, now that we have some example data, we need to start working on that Notebook. There's a lot of ways that this can be done. For me, in this example, I just ran Jupyter locally. You go to their website. You follow their instructions. In this case, what I did was I put that input file inside this directory. This is where I'm working. Then I've got this little trick, this input_dir, and ouput_dir, environment variables. I can provide those into my local Jupyter Notebook exactly like our cloud infrastructure would when it executes your Notebook in our environment. This makes my Notebooks identical on either side. Right now I'm going to hand it off to Anthony. He's going to talk a little bit more about our environment so you get a better understanding of what it's like or to ensure when you go to develop these Notebooks, they are as close as possible to the environment in which we run them for you. So, Anthony, you want to take it and talk a little bit about that?
Anthony Canterbury: Yeah. So, the environment we set up for running the Jupyter Notebooks is [Inaudible 00:17:57] based docker container. If you're familiar with docker, we did provide a public container that you can download and use for your testing. It's important to remember that due to security, the execution for these is run in an isolated virtual machine so the Notebook will have no access to the Internet. At this time we only provide support for Python 3, although we are considering other languages to support. We'd like to hear from you guys. The current running version of Python and Jupyter libraries can be found in the Notebook execution overview and the [Inaudible 00:18:37] shown right here. Right now we've got Python 3.7, Jupyter 5.7, [Inaudible 00:18:43] Conda 4.6, and Anaconda 4.5. To get a lot of these libraries and the smaller libraries below there, you can just download Anaconda, which is a package manager pretty much for data science and things like Jupyter. We've added a few extra libraries for more advanced data handling, visualization, and machine learning. A few examples would be [Inaudible 00:19:13] Open PI Excel for Excel docs, Plotly for producing beautiful print-quality graphs, and [Inaudible 00:19:20] like you mentioned, for numerical analysis and producing deep learning models. Yeah. So, that's about it. If you want more information...
Brandon: All right, awesome.
Anthony: ...remember to go to the doc.
Brandon: Yeah, exactly. I was just going to mention that. So, you'll notice on the main Losant documentation there's a new section for Notebooks. We've put a lot of helpful resources in that to help you understand one, the execution environment, which I'm showing here, but also what I've linked here in this presentation is the writing guide. So, it provides a little bit more step-by-step for you to understand if I'm developing this locally or in some hosted Open PI Excel environment, what do I have to do to get this match that Losant environment? So, for me, this is just a couple screenshots showing how I executed Jupyter Notebook locally, passing in those environment variables so my Notebook can run identical to the cloud. When that happens, you get your Notebook, and that's what I've got open here. So, I'll go through this step-by-step. A lot of people aren't as familiar with Jupyter, but really, it is a Python interactive environment, where we've got some great libraries [Inaudible 00:20:34] data. So, right up top, that's the input directory and output directory. We get those from those environment variables. Then what I did was... There's a nice little helper here, just debugging, making sure I'm looking at the right directory. So, I just listed all the content in that directory, and that's where I see my input file. If you ran this same call in the cloud, you would see that input file that we queried, and downloaded, and placed on disk for you. Then we go and just read that in, just the normal Panda's library for reading that into a dataframe. My next line here I am converting our timestamp column. So, this is a data export for a device. So, every time that device reports a state, it's a new row in this CSV, or in this dataframe. Each one is timestamped as a millisecond [Inaudible 00:21:21]. I wanted to turn that into some localized time, because the output I want, I would like that converted into my own time zone. I happen to be in the Eastern time zone. So, I did a quick time zone conversion on that. This is creating a new column that contains the day of the week and the hour of the day for every single one of those rows, because what I want to do is... No matter how much data I am looking at here—in this case it's 7 days, but it could be 90 days; it could be 10 years' worth of information—all I want to know is what's the most popular time of day and day of week. So, I'm creating a new column on every single row that will just have those two things. So, this is a simple date format. I'm just going to get something that looks like that, Thursday at 2:00 or Thursday at 3:00. Then I'm going to drop some columns. I don't need to do a bunch of work on these other columns. I could also have changed my data input. You can select specific attributes, but in this case I had selected all attributes from that device, and in this case I'm just dropping them all off. I don't need to do the aggregation on the next line with all this extra data. I don't want it in my output table. So, this is just a simple call to remove the other columns, the other attributes that I'm not worried about. Then I'm doing a group by. So, that new column, that day/hour column, I'm saying sum up every value in every row, and group them by that new column. So, in this case I'm going to sum all of the motion data and group them by Thursday at 2:00. Here is the total sum of every Thursday at every 2:00 for the entire dataset of motion. Then I'm going to sort them by that actual motion. Then this is really important. This is how you get information out of the Notebook back into Losant. So, again, we specify a directory using the output_dir environment variable, and whatever you write into that directory Losant can, if you configured it—and I'll show that in the next step—we can pick those files up and put them back into Losant either in a data table or a file. So, what I'm doing is converting my result back into a CSV. Losant can pick that back up, and you do something with it. Then I just do a simple summary here. This just shows me the first five rows. I can see on this one it looks like there's a 1:00 Tuesday at 10:00 seem to be the popular times. Then I'm just showing an example of let's just plot this information so I can see a histogram, the most popular times going down to the least popular times. This is just showing some of the really standard plotting library. Most importantly, it's this line. What's really powerful with the Notebooks is you can use them to create custom visuals. Again, you can write those to the output directory, and pull them back into Losant, and store them in files. Then what I've shown a little bit is you can put those on a dashboard. So, the visualization capability of a Notebook is extremely powerful. You can bring in... Or a lot of libraries like Plotly, Anthony had mentioned, is a very powerful and capable plotting library that you can do some really interesting things. But for me, I just did a simple take this two-dimensional table, plot it on a graph, show me a histogram mainly just to show the concept. So, that's really my Notebook. So, what happens is every time this will run, the information will be re-queried based on my input, placed in this directory. My Notebook will run on that updated data; the outputs will be placed in that output directory; and then Losant will continue. So, let's talk about what happens with those outputs. So, as you saw, my Notebook here is placing two output files back into that output directory. I've got a CSV with the table results, and I've got a picture of this graph. So, if I go back into my... I skipped a step here. After you're done developing that Notebook, you just simply upload it to us. So, once you've got it working, just upload it here. That's all you have to do. So, the outputs. I've got two outputs. The output types we can do are the data table. Take one of those files, put it back into data table. That's what I'm going to do with that CSV and the custom file. So, I could take a file—in this case, that image—and I can put that inside the Losant files. So, we also have some autogenerated files. I'll talk about those in a moment. So, we do capture a lot of information automatically for you that can be really useful. So, for that CSV what I've done here is you have to specify the filename. That should exactly match what's in your Notebook. So, right here I call it populartimes, that CSV. Basically, we're telling Losant, "Hey, look for a file that Notebook has placed there called populartimes, and go ahead and put that in the processed motion data table." Then there's some options where you want to do if the columns don't exist or if you want to override the data. That's just up to you in your specific use case. The second one I did was populartimes. Again, you're telling Losant, "Hey, that Notebook's going to put a file there called populartimes. Look for that." Then put it in Losant files. In this case, I'm just going to put it in the root directory, and I'm going to go ahead and name it the same thing. You could change the name here if you'd wanted to. So, that's describing the outputs. Your Notebook file is going to place some files, some output data. This is just telling Losant, "What am I supposed to do with that data once it's done?" Then finally, you execute the Notebook. So, after we've configured this entire pipeline. I've got inputs. I've built my Notebook. I've got some outputs. Now I can run this thing either once or periodically. So, for now let's just go ahead and click the "execute" button. Let me go ahead and click that. Again, we've got that query time. So, you could change that time, that anchor time if you wanted to. I'm just going to leave it for current time. When you click that, you'll see immediately we get an entry in the execution log, and that has kickstarted the whole process. So, let's dive in a little bit and talk about what goes into one of these executions. So, there's a lot happening behind the scenes pulling all this information together. First, all you're going to put is data queried and downloaded. As Anthony mentioned, we launch a dedicated, single use, fully isolated VM. That's primarily for security. Notebooks are essentially arbitrary Python. That can be a dangerous prospect to run inside a hosted environment. So, we bring up an ultra-dedicated, isolated VM that only lives to execute your Notebook. Then it will be destroyed. Your Notebook file and all that input data are downloaded into that VM, into that input directory, the folder we talked about. Then we run your Notebook. We just use the Jupyter runtime locally and execute it. Then all of those outputs are uploaded back into whatever those storage options were. Then that VM is destroyed. That's what's happening behind the scenes every time you click "execute." So, let's talk a little bit about that execution log while that's running. It can take a little bit. Minimum amount of time we've seen is about two minutes. There's a lot of work bringing up that dedicated VM, extracting all that information, but that can change quite a bit based on how much data that you have. So, the execution log will have a lot of useful information, especially if an error occurs. We've done a lot of work to make sure it's easy to debug any errors that might occur either within your script, like a syntax error, or any incompatibility between where you developed Jupyter Notebook, maybe locally or a cloud environment, or something is incompatible. That'll come through this execution log, as well. But you can see. We've got the input files. So, you can actually download the exact information we queried for this specific execution. Really helpful for debugging if you didn't get a result that you expected. We store all this information, every input and every output, for Notebook executions for seven days. So, you'll have these for quite awhile to go back and do that debugging. Then you see the output files. We've got our two outputs here. We can check those out. Then, these are the autogenerated files that we have. We actually execute the Notebook, and we save the executed Notebook in multiple formats. So, we've got HTML, PDF, and then the [Inaudible 00:29:27] file, as well, which is just the Notebook file. So, we execute it and then save the executed Notebook back. So, I can actually open up this executed Notebook from the past, and we can see this is a nice HTML view of my fully executed Notebook. So, you saw locally I had more files in that directory, but in the cloud that input directory just has the one file that I queried. Then we've got the table here of the output, and then we've got the graph here. So, this is the fully executed Notebook. Very helpful for debugging. I actually do have an error down here at the bottom. You can see what happens if an error actually occurs. So, in this case I had a syntax error in my Notebook itself. Actually, in this one it was trying to read an input file that I didn't specify. So, it was failing on file not found. But we put all those errors in the result log. It's a really helpful spot. If your Notebook itself fails to execute, check that log. That will be the output, like a stack trace, from your Notebook. Then, also because my Notebook failed, I didn't get an output I was expecting. So, this is another common error. You might be specifying an output file in the outputs tab, but your Notebook didn't create it. So, we're going to let you know populartimes.csv we expected that to exist, but it wasn't found. So, this is a good example of an execution log that contains an error. So, now that execution is complete. Let's go look at our output file. So, again, just to remind you what's happening here, we're taking that CSV, putting it in the data table, taking that PNG, that image file, and putting it into files. So, I can go here. Here's my data table. This is the same information. Has the day, and the hour, and the motion. Now I've got this in a machine-readable format. I can look at this in workflows and in the original case, I can put this on a dashboard using the data table block. Then likewise in files, there's my files that was put here, my populartimes image. I can click it and see a preview, and then I can also put that on a dashboard if I chose. So, let me jump back to the dashboard real quick and just briefly show that. Again, this is a data table block. I'm querying the process motion data table that's being populated by the Notebook. You could filter it down if you chose. I just chose to put the entire table here, and that's it. Sorted it by motion, and now I have a nice list view with the same information. I could also take that image that I've created. This is where some of that really complex visualization capability that Notebooks provide could be really handy. We do have the image block. So, I could go here, select that created image I just created, and put that right on my dashboard next to all my other blocks. Every time the Notebook executes, if you give it the same filename, it will overwrite that file. So, in this case if I schedule it on a weekly basis, any time someone looks at that dashboard it'll always be seeing the most up-to-date version of that visual. So, the last thing I want to do is send myself an email report. What I've created here is essentially a report of occupancy over seven days. So, I've got seven days of information, and I'm querying and processing, and I get a nice list of that information. So, what we've added, as well, are essentially two nodes to our workflow engine to make it very easy to do the scheduling, turning that one-off execution into a scheduled job. So, first I've got a timer. I run it every day at 9 AM or every Monday at 9 AM, and then we have the Notebook execute node. I just execute that Notebook. Every time it executes, it's going to go query the most recent seven days of information. So, every Monday at 9:00 I'm going to get the previous week's information. Now, since this can take a long time, and Notebooks have a 60-second total execution timeout... I'm sorry. Workflows have a 60-second timeout. Workflows are designed for the real-time processing. Notebooks could take considerably longer than that. There is now a Notebook trigger. So, when this Notebook finishes executing, it will trigger a workflow to do something with that. What I'm doing is actually downloading the HTML contents of that output. So, you can see the trigger here if I look through this information. We've got the data. That's from the trigger. We've got the execution information. We've got all the output information here. We've got the results. There's the URL that I can use to download that content. So, what I do is I use the http note. There's the path that points to this URL. I just download the contents, and then I just send that to myself directly in the body of an email. Then what that results in is a really nicely formatted email directly to your inbox with that executed Notebook. So, in this case I'm just sending the executed Notebook, but since you do have access to all of your output files, including your custom ones. So, I've got the CSV, and I've got the image. I can generate and create some pretty custom reporting logic using the workflow engine on those output files. So, really, with six nodes I've created a whole recurring data pipeline, where every day I do some pretty complex data manipulation and processing all of that information. I'm able to send that to internal stakeholders—in this case, me, but it could be somebody else more relevant, like maybe my facilities manager or head of operations might be really interested to know that information. So, with that, I'll end my walk-through. We've showed how do we query input data, how do we create a Notebook, how do we execute the Notebook against the data, how do we get the outputs back into Losant for further business logic, and then using a workflow to really orchestrate that whole thing. So, I've been watching the Q&A during this time. Looks like we do have a bunch of questions. So, we're going to go ahead and get started with those. But we do have some really useful resources. Definitely check out our documentation. We don't let any feature go out the door that is not fully documented. So, if you want more information about how Notebooks work, check that out. Forums are a great place. If you're having some challenges on the Losant side, please ask us in the forums or search the forums. The answer might already be there. Losant University is a really great video content. There is not a university course yet for Notebooks, but that's definitely coming down the line. That's hosted by Taron Foxworth. Then our blog has a lot of tutorials. So, the product announcement for Notebooks that came out last Thursday, that does have a pretty detailed walk-through of what I just showed here. So, if you want to see that again in text form, definitely go check that out. That would be a useful resource. So, at this point I'm going to start picking some of these questions, and fortunately, Anthony is available to join us to help answer these things. So, the first is... Yeah, Anthony went through some of the libraries that we have. First question is: can I add my own library to that list? Anthony, you want to jump on that?
Anthony: Yeah. At this time we're not allowing adding libraries to say what most people are used to doing. You can—it's a little complicated—add files and then input those files, or the best thing to do is really just to request it. Put it in the forums or ask us, and we'll review it.
Brandon: Yeah, perfect. Then, you had mentioned, also—this is a very related question—that our Notebooks execute on Python. We know Jupyter supports a bunch of other languages. Do we support those other languages, and how would that work?
Anthony: So, right now we only support Python, like we had said, yeah. I know a lot of people like [Inaudible 00:37:35], but that's being discussed, and we'd like to hear input on that, also.
Brandon: Okay, cool. Yeah, we talked a little bit about running Jupyter locally, and I think you mentioned our environment is a Linux [Inaudible 00:37:58]. So, if someone wants to install Jupyter locally, what operating systems does Jupyter run on?
Anthony: So, Jupyter is available for most operating systems. So, Windows, Linux, Mac, and then like you'd shown earlier, there are a ton of online cloud-based versions that are also compatible with our platform like Google Collaborate. Microsoft has one. AWS has one, and Jupyter, of course, has one.
Brandon: Perfect, perfect. Then, how are Jupyter Notebooks limited? Do we limit on number of runs? Do we limit the data size? Can you just give an overview of how we apply limits into both sandbox accounts and our organization enterprise accounts for executions of their Notebooks?
Anthony: Yeah. So, we do limit, of course, the time. It's dependent on what type of account you have. We do have three blocks, also, for sandboxing. We limit it a total amount of time throughout a month, and then, also, we limit the runtime. But the runtime is limited as the exact runtime of the Jupyter Notebook, not the imports and exports. We have limits on some of the data imports. I think it's around about a gig and a half is the max for files being uploaded to the system if an external link is provided, but internally it's just limited by how long we store our data.
Brandon: Okay, awesome. Here's a really good one, actually, for Taron. Taron joined us, as well. He actually authored that writing guide. Are there some example Notebooks I can look at? So, Taron, can you provide maybe some of those resources or mention some of the resources that you found which might be great starting points or great sources of example Notebooks that you can check out?
Taron Foxworth: Yeah, I totally can. So, Jupyter Notebooks are super popular. There is a ton of resources online to learn Python, data science, and Jupyter Notebooks. In the documentation, if you check on the left side nav, there is a tab called resources. There I started to build up some resources that can help you learn more about Jupyter and how to build Notebooks. That's going to be an ever-growing list. So, if you find something, definitely let us know so I can add it to the list. Also, the two best Notebook examples currently are going to be the writing guide and Brandon's tutorial that he wrote for this announcement. Those two both have Notebooks that you can go and look at and use those as a starting point for your application. As we continue to get more generic examples, we'll start [Inaudible 00:41:06] including all of these Notebooks within that repo. So, there will be a ton of resources for you to be able to learn and use Notebooks as you go along.
Brandon: Perfect. Thanks, Taron. This is a great question. Can you help me write Notebooks? Can I pay you to do it? So, kind of. There are a lot of great services, companies that exist in almost every city that are tailor-made for data processing. So, first and foremost, I would check into your maybe local ecosystem. Colleges are a great source of this. A lot of colleges have what might be called an advanced manufacturing group or, really, a data science group that is super comfortable with these tools. Losant also does have an internal services group. We can certainly help. We have done this complex data processing on behalf of our customers before. It's definitely worth a conversation if that's something you want to explore. You can just find us through our website and reach out. But definitely check out maybe colleges and your local services for specific companies that are very knowledgeable in that data science realm. So, I've got another question here. Is it possible for the results of a Notebook to be used in a workflow to make smart real-time decisions? For example, can I use a Notebook to calculate a smarter threshold to be used in a workflow? Anthony, you want to talk a little bit about that, how maybe you could do that with Notebooks and workflows combined?
Anthony: Yeah. So, going off the example that you showed, you can analyze your data and output it into a data table, which makes it really easy to then pull back into workflow through one of the table modes. From there, you can clean up that data a little bit more through a workflow process, or you can use it to immediately take action, command a device. You can change how your devices are performed based on what you analyze with a Notebook.
Brandon: Perfect. So, I think that's going to wrap it up. If we weren't able to get to your question, I have a list. We'll try to get to those after the webinar ends here. The recording will be made available, but to wrap up here, there's a few other little tidbits. Please join us for Internet of Things World, IoT World, in Santa Clara just in a couple of weeks. We will have some live Notebook demos. You can go check it out, play with it, talk to us about it in person. We also have a spectacular smart environment interactive demo. That's going to be quite a sight to behold. So, if you're in Santa Clara or near Santa Clara and you want to meet with anybody on the team—we've got a pretty big team out there—please find some time and come meet us. Then save the date for at least the next platform version of the deeper dive series tentatively called the feature the hierarchical experience groups. That is some major new functionality coming on the experience side. It's really going to help solve the creation of that tenancy model if you are building and publishing a multitenant experience. So, if you are an active developer using the Losant experience stuff, this is a webinar you won't want to miss. So, you can register for that on our deeper dive series landing page. With that, I want to thank everyone for joining us, and we'll see you on the next one. Thanks.