


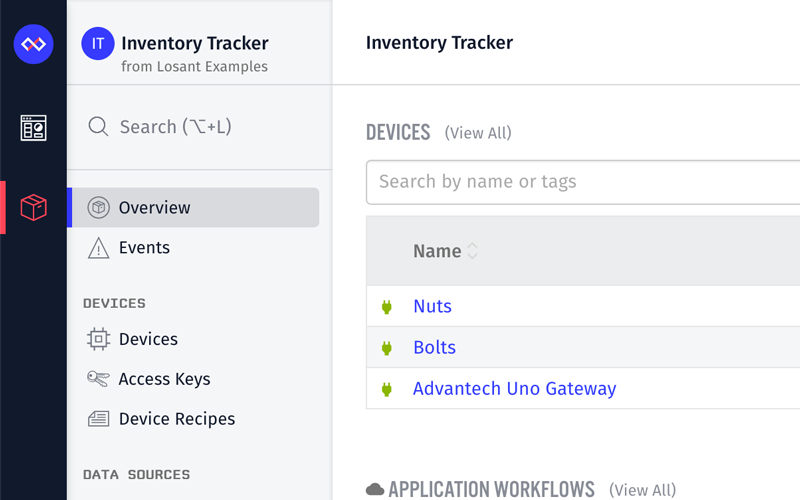


Brandon Cannaday: All right. Good afternoon, everyone. Let's go ahead and get started. I'm Brandon Cannaday. I'm the Chief Product Officer here at Losant. Welcome to our Deeper Dive Webinar Series. So, this is a relatively new series, and it comes in two different forms. The previous one that you may have participated in, as well, covers specific solutions, but this one, and why I'm on it, covers specific features in the platform. So, as we release major new updates, we're going to hold these webinars and take a deeper dive into what those are, how those work, and so on and so forth. So, speaking today, like I said, you've got me. I'm Brandon Cannaday. I'm the Chief Product Officer, and then joining me at the end—he's going to answer all those technical questions—is Dylan Schuster. He leads our team of UX engineers. So, everything we see today came to life because of Dylan and his team. Speaking of questions, throughout the webinar at any time you can ask a question. We will do those at the end. I believe near the bottom or the menu on the Zoom interface you should see a Q&A button. If you click that, that will bring up an interface that will allow you to ask questions. We will be answering those at the end, but that doesn't mean you should wait until the end to ask them. At any moment, at any time as I'm speaking, if something does come to mind, please just put that in there, and then we will go through those and, hopefully, address everyone's questions prior to the end of the webinar. We try to keep these deeper dive things pretty short. We know everyone's busy. So, we've got no more than 30 minutes of planned content, and then we can use the remainder of the hour for all those questions. So, anyone can feel free to stay during the questions or ask questions that they'd like. Just a reminder. I think everyone's probably pretty familiar with the Losant platform, but what we are is an application enablement platform. We help companies realize whatever their IoT vision is by providing the technology foundation, all the way from the edge to those full end user experiences. I brought this slide up, because you'll see some of the changes we made to the interface mirror what this slide does and how we talk about Losant. We call them components. The platform itself is very tightly integrated. So, these are not treated as different services. We just broke it apart in order to communicate where we begin and where we end in an IoT development stack. This also describes the journey a lot of you as our users will go through while developing with Losant. So, onboarding a device either through the edge compute agent or maybe directly connected to the platform. So, then you got your devices and data sources. Once you've got them connected, you're going to look at them through our dashboards or our data visualization. Then maybe you start reacting on it, building your business logic through our visual workflow engine. Then finally, culminating in some kind of end user experience, presenting that information back in a secure and completely tailored way. So, at a 10,000-foot view that's what the Losant IoT platform is. We've provided this technology and this foundation for a lot of organizations both big and small across a lot of different use cases primarily in the industrial space—industrial equipment monitoring, condition-based maintenance, maybe smarter services and support routines but also in the smart environment space. So, our previous deeper dive webinar got into that smart environment—conference rooms, buildings, campuses, how we make the places that we work and live in on a day-to-day basis a little more enjoyable and a little more technology enabled. But without further ado this webinar is an introduction into Losant's new user interface. So, we have spent a lot of time and energy on this new user interface. We've taken feedback a lot directly from you about how you use Losant. We've also extrapolated a lot of that from looking at on a broader sense how people organize their applications and all those resources, and then our own internal teams, how we go about development. We really presented with yesterday's release a really different way to navigate through, and access, and improve the efficiency when it comes to developing applications in Losant. So, what I'm going to do now is very quickly just show what Losant used to look like. Quick reminder. This is an application overview page. You're probably very familiar with this if you're a Losant user. All the navigation was on the top. You've got your dashboards. You've got your applications. Underneath the applications menu you've got the ability to access all your resources. Then underneath in the main content area was where the dashboards were displayed and where your content and your resources would be edited. So, now I'll switch to the new live interface. You can see it's a pretty big departure from what that was, but it's also similar in a lot of ways. That same navigation, those menus across the top are now presented on the side. So, you've still got the dashboards menu. You've still got the applications menu. You've still got organizations, your user account, and help. So, we took that top bar, flipped it on its side, and stacked it vertically. You also notice this blue bar. We push quite a few updates out to our platform. Our release cycle is anywhere from three to five weeks, and it can be pretty easy sometimes to miss that new functionality that could be really valuable to you. So, whenever a new platform update comes out, this little blue bar will pop up and give you a link to that blog article to read more details. You can just dismiss that so it doesn't always use up your real estate, and then that will go away until the next update comes out and shows you what might be new. So, when it comes to that application menu itself, whereas before it was across the top, we turned that sideways and made it vertical, as well. This comes out of, basically, industry best practices at this point. This is what people are more comfortable with. This is where the software world is going, and it also comes out of just looking at the data. We track through the typical Google Analytics tracking that we can get, the typical browsers and resolutions. What we find is most of you, most of our users, have a lot more available horizontal real estate than vertical real estate. So, we wanted to optimize the available screen space that you have and move some stuff around to provide more real estate for important stuff. You'll also notice on the menu itself we regrouped it to match that component slide that I just talked about. So, when we go and talk about Losant externally, it's usually in devices, data sources, visualization, workflow engine, and experiences. So, what we did was we took all those menu items on the top that were mostly randomized and then grouped those in a much more creative way. So, you'll see that same grouping. You got devices, data sources, visualization, workflow engine, and experiences. So, generally when a new user comes into Losant, as they go through their journey of developing an application, they're going to start at the top and work their way down as that application gets built. One of the changes that you might notice is we took access keys and API tokens and we split those up. Prior to this release those were tucked under, and they were grouped together under the security tab, but they are typically used for two very different purposes. The access keys are very specific for device authentication. So, it made a lot more sense to put it up here with devices. The API tokens are usually for service-to-service type integrations, where you might have a back end service that would like to either orchestrate or communicate with Losant's API itself. So, that's generally done down here. You usually create those once or twice maybe in the life of an application. So, we moved those down into the settings. You'll also notice the application log. It works very similar to the previous log. However, we did expand it to the full height of the screen, give you a little more space there, and we also changed the visual style to more closely match the real-time log that's in the workflow engine. So, we wanted to take some of our UI components and really standardize those and make those similar across different parts of the application itself. Now, this application is actually... As you can see, it's an inventory tracking. So, I'll mostly be hanging out here for this demo. It's got a gateway, an edge compute gateway, and it's got two peripheral devices that are scales. So, we've got two bins. One of them holds some bolts; one of them holds nuts; and those are connected to a serial interface on the gateway. That's what we see streaming up into this application. So, I wanted to provide a little bit of context as I navigate around. So, if I go into a device itself, we can see some minor changes to the interface in here. For the most part on all pages the content, the resources, the editing view itself is unchanged. So, we didn't make a lot of changes in how to configure and set up a device. We mostly made changes to how we navigate around those various pages. So, if you can recall from the previous UI, these available tabs used to be on the side, and now we've moved them to the top. So, it's got the same tabs that you're used to—the debug, data, simulator, and edge compute—except now they're on the top. This is replicated through many other places in our platform that had those side tabs. Now they've just moved to the top. We also moved the connection log, and, as we can see, I just got disconnected. The connection log itself used to be under the debug. However, we're trying to standardize on where we put logging information. So, they're just reconnected. So, you'll see the connection log has moved from the debug tab previously over into what we call this logging area. So, if you're looking for that real-time log information, check out the right side of the screen as we move forward and we continue to add various logging information. Next, I'm going to a workflow. Workflows, the editor itself, did not make many changes. We didn't make many changes to the editor, but this is a really good way to highlight the ability to collapse this navigation. So, you definitely want some real estate when editing the workflow. So, it's important to be able to collapse these. You can also collapse this one. If you mouse over it, you'll see a blue line, a subtle blue line highlight. You can click that, and now you've got a ton of space to work on your workflow. So, this is a good, quick pro tip to get some additional space on the screen if you need it back. On the breadcrumbs you'll see there's a little drop-down that's been added. Anywhere there's a versioning inside Losant—and right now that is on workflows or experiences—we've now added this drop-down to quickly change between those versions. So, before it was a little bit kludgy to find wherever the versions were at and then be able to switch to them, but now if you're looking at a specific version of resource, there'll be a drop-down always available in the top. So, you'll see it in the workflows and, as well, if I go into an experience, you'll see that same drop-down to be able to quickly change between those. We also revamped the breadcrumbs themselves. What we found—this is mostly internally—is anytime I was on a resource let me jump to a device I really wanted a quick way to get back to that collection of devices. So, the breadcrumbs, if you read them now, the full page from left to right, you'll see this story. It's whatever application you're looking at. You can click that and quickly change your application, as well. Then [Inaudible 00:11:54] of whatever resource you're looking at, and then it's the specific resource you're editing. So, that's the story you'll read as you look at the top left of the screen. So, I can very quickly always go back to that list of devices and switch between them. So, one of the larger changes we've made beyond just cosmetic is the switch from essentially organization or sandbox-owned dashboards to application-owned dashboards. We made this change, because what we had found, even internally, all the dashboards we create and as we watched all of our users create dashboards, was very high percentage of them treated the dashboard as essentially part of the application. They were always presenting information for devices within a single application. When we had launched this platform many years ago, we thought it was a neat idea. Maybe people want to create a single dashboard and pull information from multiple applications. Whereas we still have that capability, we found the vast majority of us internally and our users really just wanted one dashboard tied in part of that application. So, you'll see on the new data visualization menu there's a dashboard submenu. These dashboards are now essentially owned by the application. So, in this case, since I've got my inventory tracker application, inside it I can view its dashboard. What's really cool is I can then very quickly navigate between the resources that are populated in the dashboard and the dashboard itself, whereas previously you had to go to the top. That separation of dashboards and application was pretty big, and sometimes it was hard to get to the actual application if you wanted to make changes to those devices. We did automatically migrate as many dashboards as we could. We went out and looked up the entire system of dashboards—many thousands of them are created—and if we determined they were only showing data from a single application, we went ahead and put that in the application. So, you might find now some dashboards already in your application. We just went ahead and put them there if it made sense. However, you can still access them in the exact same way that you're used to, the main dashboard's menu. You can say "view all dashboards," and that's very similar to where you might have seen them before. Just like previously, those main menus do show your recent dashboards and recent applications so you can very quickly switch between those. There are some dashboards we were not able to migrate, and there are some examples here that I have. So, if a dashboard contained data from multiple applications, they're not going to be placed under those multiple specific applications; they'll still be owned by whatever organization or whatever sandbox previously owned them. Basically, we've made no changes to it. You can see that in the list by looking at the specific icons. So, in this case I'm looking at all of my available dashboards, and what is listed here is... Well, this one's owned by multiple applications. So, it's just still part of Losant's smart office organization. The icon here is our new organization icon to let you know that this one we weren't able to put it under a single application; it's just still owned by an organization. For the most part it works exactly like you're used to. Speaking of the organizations, we did make some changes to that user interface, as well. We had to, because now dashboards are part of an application. That gives you a little extra flexibility in how you can design this permission scheme. So, we had to make some changes there. So, if I go into an organization... Let's jump into our smart office organization and add a user here and show that off. So, let's say I want to add user jane@example.com. For the most part, permission system is very similar. However, the new UI makes it a lot more intuitive to understand what exactly is going on and how these permissions are inherited from the higher level resource to lower level resources. So, if I change this new user's permission to none... This is a very popular choice. So, you can invite a member into your organization, set the default, basically organization level permission to none, which means with no other changes they can't access anything. But then you can come in and specifically grant access to a single application. So, something like system integrators or development agencies, where you might have an organization, and you're doing work on behalf of many different clients, you may have an application per client, and you can invite that end client, your end customer, directly in to only that application. So, in this case you'll see the inherited role. This is basically saying, "Well, what do I get from my higher level permission?" In this case they're all none. But I can override it. So, I've given Jane collaborator permission to the Cincinnati Weather application. Then if you look down at dashboards, you'll see, since this Cincinnati Weather dashboard is now owned by this application, it has that inherited role. So, because you've granted access to that application, she does get access to all the dashboards. You're just treated like another resource in that application, but you can override that, as well. So, in this case let's say I wanted Jane to not be able to edit that dashboard, but she should be able to view it. So, now she can edit basically any other resources, the workflows and devices in the application, but she can only view this specific dashboard. A little bit about these icons. So, we did roll out some icons in various places. It would be helpful to know what we're talking about at various places in the application. So, anywhere you see this symbol, which I interpreted as four people sitting around a table, that's our organization icon. That's the highest level organization. If you click on the organization's menu and you see your list of organizations, you'll see that icon there. If you go into a dashboard list, you'll see that organization icon here, which means this dashboard is owned by this organization. Anywhere you see that symbol we're talking about an organization. The other symbol is a circle with some characters in it. In that case we're talking about an application. So, we'll see those... If you go to your application list, you'll see all of those applications. The circle with the symbol just takes the first letter of the first two words and puts it in there, and then the color will match the same color as the highest level organization. So, a visual cue to help distinguish the entire ownership tree. So, in this case I'm a member of two organizations. One of them is this dark blue color, and one of them is this light tan color. So, anywhere I see an application with the light blue color, I know that's a smart office organization, and anywhere I see the dark, that's the Losant solution demo organization. It helps me to quickly understand at a visual glance what that model might be. Then there's the sandbox icon itself. So, you can put dashboards and applications as part of your sandbox. We treat that as a testing environment, an exploration environment, prior to becoming an enterprise account, where you then have more proper organization. But in that case—you'll see it's a little hard to see on mine—that'll be your gravatar based on your email address. So, a lot of times that's your face. So, you'll see a picture of your face with the name of the application, and you know, "Oh, that's owned by my personal sandbox." One of the coolest features we've added in this update is the application-wide search. So, it was always a little bit challenging to navigate very quickly between different resources, but now there's this new search menu, and it's hotkeyed—I'm on a Mac. So, it's Option-L; if you're on Windows, it's Alt-L—to very quickly go there and do an application-wide search for a lot of different types of resources. It also shows the recent devices and workflows. If I quickly go back to the previous navigation, you'll see devices and workflows used to be a drop-down, and you would see the five most recent resources of each. It was a very good way to quickly switch between actively developed resources, but we've kept that. So, when you click the search, you'll get up to five devices and five workflows in the recent list here. So, you still have that quick ability to switch between resources you might be actively working on. Then there are some quick links for common tasks that we see people doing a lot, which is looking at devices, all devices, maybe adding a workflow, adding some dashboards, but what's cool is you can search. So, if I wanted to get to my read scales, edge workflow, I can just go in here and type "scale," and I quickly get my item. I can pretty much immediately navigate over to that workflow. Go back to a device. It searches other types of resources, as well. So, I've got some endpoints in this application. I can jump to an endpoint. So, it's a very quick way to navigate through. I know we have already internally been big users of that feature. I expect a lot of people will be jumping on that. So, in the last few moments before we get into some Q&A, I just want to talk a little bit about the future, why we did some of these changes specifically around moving the dashboards into the application itself. That's part of a much larger initiative that we're pursuing. So, we do this a lot. How we take on product development is we set our end goal, some big initiative into the future, and then we work backwards from that. So, what can we deliver that's valuable to our users that lead up to that end goal? For us, that goal is what we call application portability. We want to have that ability to essentially export most of our types of resources as a reusable template leading all the way up to an entire application. That includes the experiences, the workflows, the dashboards, the device recipes. Essentially everything we can think of we can export the entire thing as a template, and then move that to a different organization or different application, and import that back in. So, you can get some huge time savings on that. So, if you have an internal development team, you can build up these reusable templates. We'd like to launch a catalog of these applications very similar to what we did with the custom nodes. Our custom node and the node catalog was also a stepping stone towards this end goal of being able to import and export these reusable components all the way up to an application. But in order to do that, since we saw the dashboard so closely tied to the applications, we had to make this one step towards that direction and move the dashboards into the application so that it could eventually be bundled up together with the application and then imported as a way to bootstrap new development. So, that's just a little glimpse into a high level process, how we think about roadmaps and then specifically... I think there's an awful lot of benefits around the dashboard being associated with the application, but there's also this future benefit that we also receive by making that step today. So, at that point I think I've covered all of the high levels, the new user interface, some of the new functionality it brings, and where we've maybe placed and moved around some of that functionality you might already be familiar with. The primary goal of this webinar was to expose that, walk through it, provide our reasoning. That way, when you guys log in the next day, this wasn't a big surprise, where you had to go find all of your resources and all your functionality again. So, at this point we do have a few questions queued up, which is awesome. So, I'm going to go ahead and iterate through these. This is where Dylan Schuster—he leads our front end engineering team—he's going to come in, jump in, and answer a bunch of these. So, the first one is a pretty good one, a great one for Dylan. What technology was your front end built with? Dylan, can you go into a little bit of what's our tech stack, even to...? We treat our user interface like an ADPI client. So, a little bit about how that works. Yeah, that would be a great place to start.
Dylan Schuster: Yeah. So, this is Dylan Schuster. I'm the Lead UX Engineer here at Losant. On to that question, the user interface you're seeing right here is really just a wrapper around the same public API that everybody has access to, the same [Inaudible 00:24:54] API that's available in our documentation. Except for a couple private endpoints here and there, pretty much everything that our users have access to to interact with the API to create devices, and workflows, etc. we're using that exact same API in the interface right here. As far as what is actually built in the web technology is ReactJS. It is a single page application framework developed by Facebook, actually. Very popular these days. It's akin to AngularJS or Ember. There are a couple of other ones. That's pretty much the stacks of the front end is just like any web application, a combination of JavaScript, HTML, and CSS is mainly what you see right here. Making requests to the API behind the scenes, the populator within that you see onscreen.
Brandon: All right. Awesome. I got another question here. This is a great one. It extends a little bit into our available permissions. I definitely didn't cover this in the example, but Dylan, could you please answer a question here: can members have access to dashboards only and not the application?
Dylan: Yes, but with the potential for things to get a little bit weird. In this model what you can do is grant access to a dashboard and only a dashboard. Brandon, could you navigate to that screen to show? If you were not to give access to the application, the result that you're going to have there is that the user that you're granting permission to may see the dashboard, but even if you give them collaborator permission on the dashboard as if to edit it, they're really not going to be able to change any of the blocks, because if you have not given them any kind of access to the application, they're not going to have permission to [Inaudible 00:26:45] the list of devices, and the attributes, and everything else you need to configure almost every dashboard block that's out there. Short answer, yes, but do so at your own peril. It could get a little bit strange, and it would be extremely difficult for your user to make any edits to the dashboard.
Brandon: Yeah. Essentially, that mirrors what we had previously. So, what I had said up here on the screen is if you only have access to a dashboard—and that's very common if you're developing multiple applications—you can go in and just grant them view-only access. That just lets external stakeholders check out your data. You probably don't even want them to collaborate on that and make changes to it. Like Dylan said, because you didn't grant them any access to the application, they wouldn't actually be able to see a lot of the information that might be required to edit it. But this is a very common one. What would happen when you grant them view-only access? Essentially, that just shows up to them right in the view all dashboards link. They'll click that, and that dashboard will show up. They can click it and view it; they just won't see the application behind the scenes. All right. Here's an interesting question, since we talked a little bit about the API. How do you get access to the Losant API that actually powers that UI? So, Dylan, can you go into that? How do people get access to the underlying API?
Dylan: Yeah, sure. So, as far as the web interface that you're seeing right here, when you are logged in and making edits to your applications, you are logged in under the scale of a Losant user. That gives you whatever permissions that you've been granted within your organization [Inaudible 00:28:29] sandbox to create resources and then make any changes, delete resources, etc. Now, if you wanted to programmatically make changes to the API and not log in as a user, which is how most people are going to do it when they interact with [Inaudible 00:28:46] API, you'd want to generate an API token. Can you see the link towards the bottom of the application navigation down there? Yeah, Brandon, if you could click on it. Now, what's cool about this is that you can get extremely granular in the permissions that you want to allow this token to interact with. You can give them access to everything which is every single API endpoint. You can give them read-only access, which was a quick shortcut to visualize and view but not edit anything. Or as you see this really, really long list here of all the different API calls that are in the Losant API, you can check individual sections for individual actions themselves. Only as an example, let this token get and update devices but not create devices or delete devices. I just want to point out this is different from authenticating as a device against the [Inaudible 00:29:44] NCCC broker, which is managed through the access keys up in the devices section. Through the broker, you can receive commands on the device or send a device state. You can't really do anything as far as the metadata of the device itself. You can't change the name of it, add tags, etc. That all would be done through the [Inaudible 00:30:05] API with the token that you generate here.
Brandon: All right, cool. This is a great question. Since we introduced the search, we've got a question here that expands a little bit on that. So, is there an overall search regardless if it's a device, attribute, or text within a dashboard? So, I think that question is: can I add a block maybe to the dashboard that allows people who can see your dashboard to search the resources within that application?
Dylan: Within a dashboard, not yet, I would say. That doesn't mean that we could not add that in. At the moment the scope of the search is to find resources within an application. As Brandon already pointed out, most commonly devices and workflows but a lot of other resources inside of it, pretty much anything that has a name [Inaudible 00:30:53] that search by the name of the resource or some things that are named, such as experience user search by their email, domain names, and [Inaudible 00:31:02]. But it's a good suggestion. We can certainly catalog that and think about how this search works moving forward and what are the things our users are actually searching for and trying to use the platform to achieve.
Brandon: Perfect. So, here's another one that I think I can answer since I've got the screen up here. Will you add recent workflow and recent device lists like the previous version UI? So, I might have covered that a little too quickly, but I'll just show where that is in the new interface. I agree. He went on to list a specific use case where switching is valuable. Where those lists live now is right in the search. So, if you click the search, we prepopulate that with those two lists. So, [Inaudible 00:31:46] the workflow icon is the workflow, and any device icon is a device. So, that same information that was under these lists are now in this one list here. So, it still makes it fairly easy to switch between those quickly.
Dylan: Yeah, and if I can just add to that very quickly, over the next couple of releases we're going to continue to add some additional changes here, nothing, obviously, as major as what you see right here but some improvements along the way. One thing we want to take a look at is our application overview page. I am, at least early on here, thinking that we definitely want to bring those lists of recent items, not just [Inaudible 00:32:25] and workflows. We're going to introduce some other recent items onto that application overview, redo what you see right here, and when you get to that first jump into an application, you've got a quick way to get into whatever your recent items are, which is, of course, whatever you are in the process of actually editing at that time.
Brandon: Here's another question. This is actually a really good one. So, someone here noticed this events menu is now moved up to the top, and the question is really: I see the events is moved to the top. I've always been a little confused about when to use those [Inaudible 00:32:59]. Can you explain a little bit more the purpose of the events?
Dylan: Yeah. So, we think of events... And when we first created the feature as an event, is an anomaly within your application that must be acknowledged by a user, and then some sort of resolution to the event must take place before it is basically wiped off of the books. We moved it up to the top of the screen you see here. This particular application doesn't actually have any events, but if it did, there would be a little indicator icon next to the word to indicate the number of events that are currently open. A couple of reasons we put it up there. Number one, because it is a notification that's important, we wanted to make sure we got it above the fold. This is a nice, big screen here, and we can see the entirety of the sub-navigation, but if you were on a smaller monitor, this panel would start to scroll to accommodate all the content, and we wanted to make sure events made it up to the top since it is something that is prescient and important to our users. Number two, it doesn't really fit anywhere else, to be honest, because it spans the entire application as a whole. It can be tied to device state, most commonly device state if the device is recording something that is confusing, or really, you can log an event of anything in the workflow [Inaudible 00:34:19]. So, that's why we put it at the top of the page and how most of our Losant users are using events. There are a handful that are using them for their own purposes, and we are certainly okay with that, but with the idea in mind that an event is something that needs resolution and relatively quickly, we wanted to make sure we got that front and center.
Brandon: Yeah, perfect. I agree with that. There was always a little bit of confusion around events probably due to the name. I know there's a lot of other IoT services out there that refer to an event as what we would refer to as state. So, an event is a sensor reading coming off a device, whereas our events are capturing much more rare occurrences. So, definitely can understand where that confusion comes from. A great question here: are there plans in the near future to add additional dashboard block types, info controls in particular as well as higher resolution maps?
Dylan: Absolutely on all counts. As far as additional dashboard block types, a lot of the types that we ultimately add to the platform come from our user recommendations in the forums. If you've got a very particular type of block in mind, please let us know. We are happy to roll them out. We love to see when people are using the new ones we introduce. As far as input controls, if there's a type of input... For those who don't know what an input controls block is, this is a dashboard block that allows for... Basically, it's a form that's embedded in a dashboard that the user can adjust the values of. We've got a range slider for choosing a number, text input, a Boolean toggle that when the user clicks the button, it then fires a workflow that sends a command down to a device. If there's some sort of control there that we are not covering, please let us know. We can certainly add that. As far as other dashboard types, we've got it on our horizon. It's been about two months now. We introduced some additional gauge types to the gauge block which, for our long-time users, it's the one that looks like the semicircle wheel. I don't know if we have any on this dashboard, but here is actually the tank version of that block. Brandon, if you wouldn't mind navigating into one of those, you could see how that would look under the different types. We're going to add a couple different types here. If you have any suggestions in mind, please let us know. What I also want to do is add in the ability for you to give us basically HTML in a custom style. We'll expose some variables to you so you could actually write your own gauge inside of this space. I don't have a timeline on that yet. It's probably going to be a couple months out, but we would expose as starting points the different gauges that you see right here. So, you could copy the very source that's used for that same one to either tweak it for your own needs or just to give you some inspiration for how to move forward. As far as the maps go, the resolution of the maps is dependent on our provider. The United States has pretty high resolution. I know that some of our users in other parts of the world have raised that question before about the quality of the maps and of the imagery. I know that they are rolling out additional high res images to those areas. Unfortunately, we are at their mercy there. We've been told it's a couple months until we get... New Zealand was one that we got a lot of questions about. Hopefully, that gets rolled out a little bit quicker.
Brandon: Okay, great. This is a really cool question: is there any planned support for management of unused, or underutilized, or unutilized devices and dashboards? So, essentially, in the management of a larger number of devices across multiple applications, it can be difficult to identify resources that are unused or obsolete. That's a pretty cool feature idea. Dylan, do you have any comments on that?
Dylan: Yeah. If I understand correctly, the way... So, it would be a matter of identifying which devices have not, for example, connected to the broker in an extremely long time or reported a state in a very long time. We can certainly expand the search capability of the devices to bring that information in and allow you just to sort and identify those devices a little bit easier. I do eventually also want to bring in some more bulk editing capabilities into the front end of the application. If you've ever tried to delete a device right now you know it can be a bit of a slog. We did that on purpose. Deleting a device is a big deal. You don't want to accidentally delete one, because once it's gone, not only is the device configuration gone, but all the data that was tied to it is, also. If you set up a test application—you set up 100 devices—and then you eventually want to wipe those out and go to your production build, it can be a little tedious to delete 100 of those devices. So, I want to bring in some bulk editing capabilities like a checkbox interface into the tables to select multiple ones and then delete them all in one swoop. Hopefully, that answers the question. Yeah, it's a good point about doing a little bit better to provide tools to identify resources that are no longer really part of the application, especially if you're in a sandbox and you're trying to free up resources for other projects.
Brandon: Excellent. So, here's an interesting question. Essentially, do you have device templates that could be implemented in addition to the ones that we provide? So, I'll start on that a little bit and then, Dylan, if you want to go into the device recipe concept. From a high-level Losant doesn't really provide any opinionated device templates or device types. If I go into a device, really, what a device is is a collection of attributes, and that is entirely up to you. In this case, since this is a scale, I'm reporting the raw weight, and then, since I understand how much each unit in my inventory weighs, I can calculate the units and record both of those. So, the attributes are the most important piece, and then tags allow us to add static configuration information. So, in this case, since this scale connects serially, I am tagging it with the actual serial port whenever you plug it in. That allows our edge agent to connect to that serial port. Then, also, I have the per-unit weight that allows me to do that translation from the total weight to the number of units. So, there's really no concept within Losant to say this is a scale; this is a temperature probe; this is something else. It's really entirely defined by you. Dylan, do you want to go into the concept of device recipes that allow you to create your own templates?
Dylan: Yeah. So, a device recipe, if you've never used one before, is much like the name sounds. It's basically a template for quickly rolling out a number of devices that share similar attributes and similar tags. So, a great example of this would be if you've got a fleet of 1,000 trucks. Well, every truck in that fleet is reporting its fuel level; it's reporting its speed; it's reporting its trajectory, etc., etc., etc. They may have some common tags like these 300 maybe in the northeast and these 400 maybe on the west coast. Using a device recipe you configure it much the same way you configure a device. The interface is extremely similar to what you're seeing right here. Then once you've configured that recipe you want to roll out to those [Inaudible 00:42:06] devices, you can then do a bulk creation of those devices against that recipe. It's not just every single device following the exact same tags that you see right here. You can actually overwrite tags during the bulk creation process via CSV. So, we allow you to export CSV if you use a template. Make your edits. You would then import it. Then you can quickly roll out an entire suite of devices.
Brandon: All right, perfect. So, I think I'm going to do two more questions, but while we're doing these last two, I wanted to bring up some further learning. These are great resources that we provide. The documentation, that was entirely updated to represent the new navigation. So, you won't see any old screenshots. We want to make sure we take great pride in our documentation to make sure it's all up-to-date. So, go over there. It's very detailed, very thorough. If you are not already utilizing Losant, please jump into the sandbox. It's a forever free tier with up to ten devices and a million payloads per month, and you have access to nearly all the capabilities of the full enterprise install. Then Losant University. So, that's a great source of knowledge. It's video and workshop material. That's all hosted by Taron Foxworth, and that's a much more thorough guided viewpoint through Losant and its features and functionality. So, one question I wanted to get to, Dylan. We talked a little bit about it already about what's coming down the line or what our ambitions are, but I think this is great time to just ask Dylan from a higher level: what's planned; what planned updates do we have; where do we want to go; and what are the things we want to add to our user interface?
Dylan: Well, how much time do you got? We do have a pretty significant backlog over the next few months of other [Inaudible 00:44:08] we want to roll out into the second version of the interface here. Nothing that's going to be nearly as big of a bang as what you've seen here with the rollout of v2. Just off the top of my head, we want to give the workflow engine a little bit of a visual revamp. We don't really want to alienate anybody who's already learned the ins and outs of the engine, but just make things a little bit tighter and a little bit easier for new users to dive into, add some little interactions that make it easier to connect nodes together very quickly. I'll leave it broad like that, but that would be one area. There are a couple of other passes across the user interface to bring, for example, some of our alerts up to the new visual style, perhaps introduce a notification center. You see these little [Inaudible 00:45:01] pop up at the bottom of screen that this device was created, this device was updated. Keep that somewhere in a log for people to see during a session in case they wanted to go back and replace some of the changes they made. I would very much like to bring the help much more in line with the experience. So, you had seen the search drawer that popped out before, this search within an application. There is a little help icon in the bottom left corner which [Inaudible 00:45:25]. If you click on that, you'll get a little flyout menu to go check out these forums or the documentation if you have a question about how to do something. I can almost guarantee you somebody else has posed that question before, and you can find the answer there. What I'd like to do is bring that... Since that's kicking out to that website, bring that experience inline into the interface and have it also be conceptually aware of what you're doing at that time. So, as an example, if you are on an edit device page and I were to click on that help icon, the top five suggested results would be things about editing a device, or if that device happens to be an edge compute device [Inaudible 00:45:58] edge compute. Then directly from the interface being able to search for additional questions you may have or if you can't find the answer, it would take you over to forums. If anybody has ever used TurboTax, they do something very similar. I'm a really big fan of that. That's where that inspiration would come from. Those would be the really big things off the top of my head. There's a couple of other little ones here and there that we'd like to address, but we're really trying to improve the experience overall and make this a little easier [Inaudible 00:46:29] to get started with Losant. Then as you become a power user in the system to really move around quickly and not let the interface ever be the [Inaudible 00:46:39] slow you down.
Brandon: All right, perfect. So, there's a couple of quick housekeeping questions that came in that I'll get to. One is: is the new interface available for all users in sandboxes? Yes, that's true. So, if you're a sandbox user, you don't have to be a paid organization to access it. Essentially, what has happened if you logged in over the last 12 hours—I think we flipped the switch yesterday at about 4:30 PM—you will just immediately have access to all of the new functionality. Another quick question is about a video. This is recorded. You will have access to that recording afterwards. So, just keep an eye out for that notification via email, and you'll be able to download and review this video at any time or share it within your organization. If you do have people that you know weren't able to make it but would be interested in this material, please send them this recording. The last one, very important is: how can you provide feedback? I would recommend going to our forum. So, a lot of what we do, a lot of the changes that we make do come from suggestions and recommendations directly from you guys. So, we do have a very active forum base. It's just forums.losant.com. You can come in here. It's a great place to learn and the first place I'd recommend if you do have questions because a lot of the time someone else might have already asked it. However, if you've got a recommendation, or find a bug, or would like to see something different, just drop it into the feature request. It's a great place to provide that feedback to us. With that, the last thing I will say is make sure to queue up our upcoming deeper dive webinars. So, we've got one on March 12, which is specifically around equipment monitoring. So, unlike this one, where we're just diving into specific platform features, that one is going to go into a use case and show how Losant is utilized to bring that one to life. March 26 there is an asset tracking one. So, a solution-based deeper dive. We will continue these platform-specific ones. I know we already have a recommendation to go through some of the experiences functionality. I know that can be a little complicated, and that's a great one to dig into. But, again, if you've got recommendations for deeper dive webinars that you'd like to see around specific solutions or specific platform features, please just drop those in the forums. With that, I will thank everyone for joining us this afternoon, and a special thanks to Dylan for making his time available to come in and answer all of these technical questions. We will see you at the next deeper dive. Thank you.