


Craig Baldwin: Hey, everyone. Thanks for joining us for today's Losant webinar. As a part of our Take a Deeper Dive series, today we're going to explore a smart environment solution that the Losant team built with the help of our partner Rigado. This particular solution is going to be about a smart stadium experience and we're going to walk through that a little bit later. Before we get started I want to introduce you to today's speakers. First, we have myself, Craig Baldwin. I'm the Partnerships Director and your MC for today's webinar. We also have Kevin Tate, Chief Revenue Officer from Rigado, and Scott Allen, Solution Architect at Losant. When we get to the question part of today's webinar, we're actually bringing in Taron Foxworth who's the Head of Education and Training at Losant as well. A couple administrational items before we get going: first and foremost, if you want to ask a question please feel free to do so at any point. You can do that using the Q&A feature within Zoom, or if you ask via the chat we'll capture that as well. Towards the end of today's webinar, I'll go ahead and address each of those questions with the proper team member and we'll make sure they're all answered before we finish. If, for whatever reason, we go past our time window of 30 minutes for the questions, don't worry. The entire webinar today is recorded and we will send you a recording after it's complete, usually within a couple of days. So, don't feel like you're going to miss anything if you leave us. Just as a quick reminder, Losant is an Enterprise IoT Platform. Our tools are used for application enablement for all sorts of IoT solutions out in today's marketplace. Our platform is made up of five key components that our partners and customers use to develop those solutions: edge compute, devices and data sources, data visualization, visual workflow engine, and end-user experiences. Today's webinar is really going to focus on data visualization, devices and data sources, as well as the visual workflow engine. As a quick reminder, here are some of our customers: Bosch, Verizon, Proctor & Gamble, Hewlett Packard Enterprise. Losant is an enterprise-ready platform that focuses on the industrial smart environment in telco spaces. So, let's talk about a smart stadium solution. It's a big, hairy topic that I think a lot of people are interested in learning about, and we're going to describe to you our flavor of that that we implemented at a live event, just a couple of months ago. So, what is a smart stadium? In our case, it was actually giving it a real-time utilization of all the suites -- or seats, excuse me -- in the Losant suite that we had at a local tennis tournament just a couple months ago. So, throughout the course of an entire day, using RuuviTags, Rigado gateways, and the Wi-Fi provided by another partner of ours called PowerNet, we were able to send that data to the Losant platform and provide real-time visualizations and historical analysis over that data over the course of the entire day, and solve some really cool trends based upon which players were playing and what the weather was like. Scott will get into this a little bit later. Before we move on, I want to introduce Kevin, who is our team member -- or rather, our partner at Rigado, and he's going to give a little bit more information about Rigado, how their solutions work, and, of course, how he worked with Losant on this particular application.
Kevin Tate: Thanks, Craig. Thanks for having us and it was exciting to be a part of the solution and exciting to get to talk about it. I'll spend just a few minutes setting up kind of what we do at Rigado so people know how we fit into the solution and work with Losant. So, Rigado's focus is on providing Enterprise IoT data for solutions like this one. We do that primarily in environments like smart office and smart buildings, logistics, retail stores, and warehouses. And usually, the star of the show is our gateway. And, so, in this case, the Rigado gateway was used to connect to the sensors that were actually on the stadium seats and collect and process that data and deliver it up to the dashboard, and we'll talk about that. We work with lots of different partners to do that, both on the software and the hardware side, and a lot of times what Rigado is being used for are use cases that rely on Bluetooth Low Energy to do things like asset tracking, or sensing and monitoring within in a smart space. On the next slide, you see a little bit about kind of how we look at pulling data from those commercial spaces. Generally, there's sort of two buckets. Our customers are either interested in what's going on with the building, as we like to say; so, safety and security in the building, finding stuff in the building, integrating with building management systems and energy, and for that, we see our gateways used as IoT Edge Infrastructure. But -- and in the case of the smart stadium -- gateways are also quite good at specific Enterprise IoT applications, where you might be tracking a particular set of assets or equipment as they go through workflow, or monitoring temperature for cold chain, or knowing whether something is occupied or unoccupied in, like, a conference room or, in this case, a stadium seat. And even doing predictive maintenance. So, we tend to break up our use cases and the role of the gateways and sensors that we bring into these, sort of, what's going on with the building versus what's going on inside the building. And on the next slide, a little bit about kind of what we've learned from doing that for, really, almost ten years now. It's hard to get data out of smart spaces, and, in particular, there's a lot of redundancy that gets created as companies look to collect different types of data from lots of different types of sensors, all of which have to connect and deliver the data, process, filter, aggregate, and make sense of that data and then deliver it to lots of different endpoints. And so, in this case, of course, the endpoint we're delivering to is Losant. But there's often a lot of different things that people want to do with that data from a single environment. And, so, a lot of what Rigado provides is that simple, secure, consistent platform to collect that data and deliver it to the cloud where it goes. On the next slide, you can see a bit about sort of how we do that -- and I won't go too far into the nitty-gritty here, if you'd like to learn more about Rigado and our gateways, just check us out at rigado.com. But I think what we see most important for solutions like the connected stadium is, first, flexible device connectivity, so being able to use low-cost, long battery life sensors for things like Bluetooth 5, we also support Wi-Fi and mesh. We can gather data from a lot of different types of sensors. We have a part of our platform we call Edge Connect, which is particularly good at processing and filtering, normalizing, aggregating that data at the edge. And that's important not just so the data gets where it needs to go in the cloud, but also to keep things like data rates down, and making sure we're just sending the data that matters up to the cloud. And then on the cloud side, we integrate with lots of different enterprise application providers. One of the things we love about Losant is that the data we're providing can go right into action in the form of intelligence and analysis, and we're going to take a look at that in a minute. And then, as you would expect with hundred...no, thousands of gateways in the field, we think a lot about manageability and security at scale. So, we have a set of tools that allow for the deployment, the provisioning, and the management of the gateways at very, very large scale, and that's all part of the Edge as a service that we offer. And then, finally, on the next and last slide, here's a little bit about the role that those gateways play in the solution, the demo you're going to see. So, the platform component I mentioned before, Edge Connect, is doing the heavy lifting here. It's collecting all the data from those asset tags and monitoring tags -- in this case, it was over BLE. We're filtering and formatting that data, putting it into JSON, in this case, so that it is ready to be securely delivered up to Losant. And that can either, as you'll see here, go into the data warehouse for analysis and visualization, importantly it can also trigger events, and so if that data was something that needed acting on right away, Edge Connect would also be the platform that hears, "Hey, we need to turn that equipment off before it tears itself up," or, '"Hey, I just got a request to shut down the HVAC." And, so it provides this two-way communication with the intelligence in the cloud and the actions that it seeks to trigger. And one of the things that makes this extremely portable is reusing industry-standard JSON and APIs for all the configuration management of that data flowing from the sensors up to the Losant platform.
[Crosstalk 00:09:46]
Craig: Yeah, thank you, Kevin. That was fantastic. So, you know, Kevin is the CRO at Rigado. His job is to sell the capabilities of Rigado. But I can say, with ultimate independence, that, as a part of using the Rigado solution in our smart stadium experience, there was a moment during the tournament where one of the gateways was actually unplugged. One of the attendees in our area -- I don't know what they were doing, maybe they had to charge their phone -- unplugged the gateway, and suddenly all of the tags that report into that gateway jumped over to the other one. So, even though we sort of optimized the set-up for a gateway to handle about 20 or so tags in a specific area, the other one picked up all the tags and the solution worked perfectly. So, I was kind of shocked when that happened. I was a little bit worried that we would lose some data, or I'd have to kick somebody out of our area for touching stuff they shouldn't, but props to Kevin and Rigado, it's a fantastic gateway and it worked really well. So, with that, I actually want to introduce everyone to Scott Allen, who's going to walk through the solution and talk a little bit more about how we leveraged this data to provide a pretty interesting smart stadium experience.
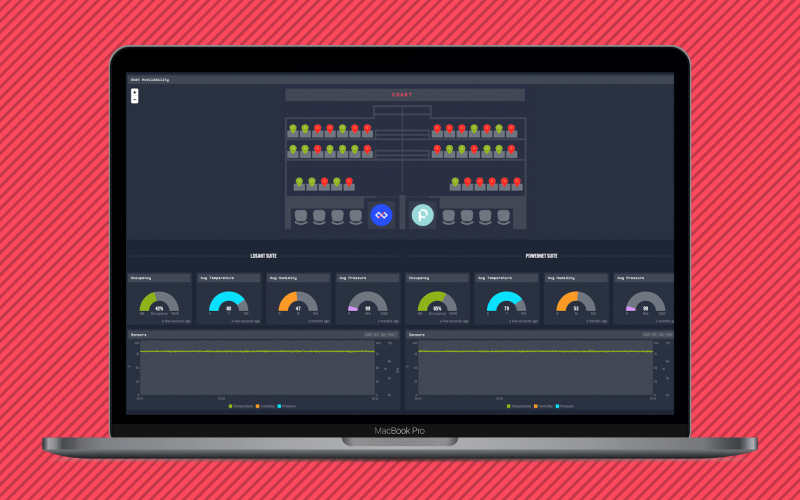
Scott Allen: Okay, thanks Craig. Yeah, we are here today to talk about a smart stadium application that we put together. And before we get too far into it I do want to mention that this architecture will work for other environments as well, not just stadium. If you have a different type of smart environment that you want to create an application for using the Losant platform, your sensors and your attributes may change but the basic architecture will work for all smart environments. So, last August, Losant worked with our partners Rigado and PowerNet to create a smart stadium application for the ATP tour at the Western & Southern Open here in Cincinnati. In the application, we monitored real-time usage of over 40 outdoor seats and visualized that usage with our dashboards. Now, Ruuvi sensors were placed on each seat and they communicated with the Rigado gateways. The Rigado gateways, in turn, used the Wi-Fi networks provided by PowerNet and transferred their data up to the Losant platform, where we can show the information on our dashboards and our user experiences. So, that's what we're showing you here on our first slide. We wanted to show you a picture of what the Ruuvi sensors actually look like on the seats. The Ruuvi sensors were monitoring the seat position. So, when it's in a vertical position like you're seeing here, there's nobody in the seat. However, when it's more horizontal when somebody's sitting in it, that's when it will be reporting back to us, as well as some environment attributes like temperature and humidity. The first thing we wanted to show you inside of the application is how we used the Losant systems as a way to collect and aggregate our data. Now, Losant systems are used to construct a digital twin or a model of your environment. So, we used it as a way to organize the seats so that we can organize the data by what row the seat was in and what suite the row was in. So, here on the far right, we have our actual devices, and those are the Ruuvi sensors coming through the Rigado gateway. And, from that, we have assigned each of the seats into a row, and each of the three rows are assigned to a suite. Same type of thing we did for another suite for our PowerNet partner. Now, let's take a look at the devices and how we use them in our system. First of all, we have our Ruuvi device, which is like every other device you define in the Losant platform, that you can mention whether it's a stand-alone device, in which case it is collecting the information but also transferring it to the gateway to transfer up to Losant. And, also, you would define the attributes that you're collecting from each of these devices. In this case, it's everything from the battery to the temperature and the humidity of the area and the orientation of the seat. The one thing that is different about this working in our systems environment is that each device will define its parent system. In this case, it's the row that this particular sensor is located in. Each sensor can only have one parent, so it's how you organize your system, how the data will be aggregated as we move up. Now, the other type of device we created for this application is a new type of device called a system device. And that just means that the system device isn't a true physical device, it's used as a container to aggregate our data from the child devices. So, it has a similar type of information. You can define device tags, other information. And the attributes you define are a little different. And that is you define the attributes that you want to collect at the system level and give it a name and a number just like you always do, but then you specify how we're going to calculate this value. In this case, it is a count of the number of seats that are occupied in this row, so we are going to the orientation attribute of each of our devices, of all of them, and we are accumulating them or summing them together to get to our number. Now, we have the option of being more specific, to say that I only want to collect this information from certain devices, or I can exclude devices depending on what I want to do. But, in this case, we're getting the information from all of the devices that have been linked to this system device. Same thing for the temperature, we're defining it as a number, but down here we're saying we're going to take the temperature of all of the child devices linked to it and we're going to take the mathematical mean of all of those values to show it as the temperature for that particular row. And then, by looking at...going back to our system explorer, we can see how the items are linked together and how we can aggregate that data. So, let me show you one of the dashboards we created. It is...sorry, here. And this is just a simple dashboard that tells us, at a particular time -- this case about 9:30 in the evening -- which of the seats are occupied right now. So, here we have the seats, the rows, and the suites that we are monitoring. Also down here we are displaying, in our dial indicators or dial gauges, the temperature, humidity, and the average air pressure for the suites. And we get that by accumulating all of the information as it's reported by the seat sensors and from the rows. Now, one of the main goals of this application is to show how the seats are being used over a period of time. And to show this, we wanted to use a different dashboard block, called an Image Overlay Block, to show that information. Part of the image overlay is where we will take a background image -- it could be a map, a floorplan, in this case, it's a seating chart -- that we want to use behind it and we want to show, both in a numeric format and also in a visual format, how often that seat has been used over a period of time. So, the first thing we did is define the background image. You can upload it to Losant or just provide a URL if it's stored outside of our platform. And then we wanted to create two queries. One that will tell us the number of times that the actual sensor reported that it was in use, and the total number of times that it reported any value to the platform. So, the first one is how many times was the seat in use? So, we create a query to a specific device -- this is the sensor on a particular seat -- and we're looking at the orientation value, because a one indicated that the seat was in use, a zero indicates that the seat is not in use. And we're going to sum that value over the last 12 hours. Our second query is just counting how many times did that particular sensor report in for those 12 hours. So, we have the information that we need to do...and the next thing we're going to do is create two overlays to present this information. The first overlay is a label that is going to show the number in a digital format or a decimal format. And then we're going to show a bar chart with that same information. So, what we want to do in each case is format the information and for...I'm sorry, format the information in a way that makes sense for our particular chart. So, what we do is, for the label, we created...and for the text of the label, we're going to use our handlebars as a way to do the math to come up with the percentage, and then format it properly. So, working from the inside out, we take the total...the summation, how many times did it report the seat in use, divided by the total count. And that will get us a percentage or a decimal value for that. But since we want to display this as a percentage, we're going to multiply that by 100 and then we're going to format it so that we have one significant digit to the right of the decimal point, and it's followed by a space and a percent sign. Now, we were able to do all of that by just formatting the label here, including both query results in the format. The second overlay we wanted to present here is a bar chart, and the bar chart is going to show the same type of information -- the total number of times it was used divided by the count -- but in this case, we're showing it as a bar chart in a vertical form, and we can specify the length of the chart to make it fit. But also with the bar chart we have the option of using different colors based upon the value. So, here, for this particular seating chart: if something was below 18% we're going to show it as a green format. If it is between eighteen and twenty-seven percent, we're showing it as the amber color. And if it's over 27% we're showing it in red, just to let the eyes see where the seats are being used the most. Now, we can position these charts anywhere we like and I can do it either by putting in the exact position on the file where we'd like it to be, or I can use my preview window and drag it to a new position if I like. So, it's a very easy process to create. Also, once I have created my queries and my overlays for one seat, I can easily come down and clone each of these so that I can then move it over for the next seat, and so on and so forth. So, really, for each of the 40 seats, once I got the first one formatted the way I want, I just cloned it, moved it over, changed the device, and it was ready to go. So, let me show you what the entire seating chart looked like with all of the seats showing their position. And we can see different levels depending on how popular those seats were. Now, I just want to go back for a second to talk about the image overlays, because there are a lot of options that you can use with these. You can create different indicators, with different shapes or colors depending upon the type of information you want to present. There are values like we used today with a dynamic text that you can create. Bar charts in either a horizontal or a vertical layout. Images can be displayed either from files that you've uploaded to the Losant platform, or URLs that you have, or other options. Now, all of these options are defined in our documentation section. There's a whole page set to image overlays that gives you lots of examples and specifics as far as how to create your queries, how to change the icons, and the type of overlay that you want to use. So, if you haven't done so already, I would encourage you to take a look at the documentation page in order to learn all of the oppor...all of options that are available to you. Now, going back to our final dashboard with the image overlay for all of our seats, we can see how these seats have been populated over the last twelve hours. And, from this, we learned quite a bit about it. For example, we learned that the corner seats in the front row were not very popular with people. They were really only used when no other seats were available. We also learned that the rows closest to the suites themselves were more popular than the others. There was a rain delay during the day, so, as you might expect, the seats were not used much during that particular period. And, also, we learned that during the morning these seats were in the sun and got quite warm, sometimes reaching 97 degrees, so some of the morning matches may have been a little uncomfortable. So, we were getting that from just the sensor that was on each seat. Now, we know that tracking seats is really only one source of information about where people are in the stadium. There are sensors that can anonymously track the location of people as they're walking through the halls, standing in the concession lines, waiting for your ticket, and other places that have a significant impact on the fan experience. Now, by implementing the technology like we've shown you to understand an environment, provides a groundwork to experiment and innovate so that the results are more efficient, engaging, and you have a safe stadium environment. So, at this point, I am going to turn this back over to Craig for any questions that you have.
Craig: Awesome, thank you so much, Scott. That was a great presentation. We appreciate you walking us through the solution. My personal feeling was that the seats in the corners were the least-utilized throughout the entire event because they were the furthest away from the food and drink. So, I don't know what the actual reason was, but that was my guess while we were at the event and looked at the data afterwards. So, we just went through a lot. We touched not only the solution overall, but touched a lot of different pieces of Losant. Losant is a robust platform to develop solutions with, and so in order to help you on your way, we have some resources that you can utilize. First is the Losant documentation, found at docs.losant.com; our forums at the community, this is for how-to questions and how to leverage Losant as a part of your build; and then we also have Losant University, which is more video-based content; and then hands-on tutorials. So, hopefully, these are all great resources for you as you start working with the platform and build out your solution. Now, from here we'll turn to some of the questions. So, one question that we received early on was: how would this technology apply to a separate environment? So, could I take the same components and utilize them in something like tracking forklifts within a warehouse? Scott, is that something that you'd be willing to answer for us?
Scott: Sure, I'd be willing to. Yes, this is something that could very easily be adapted to other environments. It's just a matter of what you're tracking and the sensors that you're using. Especially in a warehouse, you could use the Rigado gateways as a way of tracking the sensors on forklifts as they move around. And then just change the dashboard to show the floorplan of your warehouse rather than the seating chart that we have here, and everything would work fine.
Craig: Awesome. Thank you, Scott. So, another question we had is: what type of range can we expect from the Rigado gateways? And then, of course, what type of network options are available? And since you're the expert on Rigado, we were hoping that maybe you could help us with that question.
Kevin: Sure. So, from a network perspective, the gateway is a bit of a Swiss Army Knife. It does Bluetooth 5, Thread, Zigbee, Wi-Fi, and then it has Ethernet and cellular for back-call. A lot of our customers use either cellular -- and we have you can insert your own SIM -- or they use Ethernet with PoE, so you just have one cable for both ethernet and power. From a range perspective, most often our customers are using BLE for sensors like this. We've done a lot to improve and increase the range on our gateways -- we use a power amplifier and an LNA on the Bluetooth module. 100 meters outdoors is not uncommon, but if you're inside or you're in a building, you've got to go through walls, we typically talk about more like 30 to 50 meters. So, again, it depends on your use case and environment. But indoors a good rule of thumb might be one gateway can cover between three and five thousand square feet.
Craig: That's awesome. So, Kevin, as a follow-up to that: we've talked about this before but we didn't actually use the Losant Edge Agent as a part of this solution and I know that there's probably some application space that's available on those Rigado gateways. Can you just give us a little bit about what that looks like? Do these gateways come pre-configured or programmed? What type of application space is available and how potential builders can leverage it?
Kevin: Yeah, sure. So, to keep the gateways secure and encrypted in the field we use a secure OS from Ubuntu: Ubuntu Core. And it uses a containerization model. One of the applications that we offer in a container is that Edge Connect that I talked about. And it's often what customers use for sort of basic data collection, filtering, and delivery. There is, as you mentioned, also the ability to run your own applications in a container. And, so, we have people do that a lot of times if they have a specific network configuration or actions that they want to take in, like, a smart lighting environment. Or, if they're coming from...a lot of times they've been working on, like, a Raspberry Pi, or a prototype gateway, and now they want to take that same application and run it sort of for real in a production environment. And that's the same container we can run the Losant Agent in as well.
Craig: Awesome. Thank you. So, a question we just received -- and this is a follow-up to the previous one about that forklift use case, Scott -- is, I think, a little bit about dynamically updating a location, potentially on some type of map or on a 2D map. Can you talk a little bit about maybe the capabilities? If we wanted to plot location using Losant, how would you do that, maybe using image overlay and something maybe like a position block that we have? Scott, do you mind helping us with that?
Scott: Sure, I'd be glad to. Yeah, if you have a device that is moving and you want to show its progress, it's just a matter of plotting that on an image overlay block like we did before, except that this would change as each device goes. So, we've done that before on some of the previous blocks. It's just a matter of recording the current location, doing any kind of math conversion to plot it accurately on the overlay, but, yes, then it would be able to stay up-to-date with the latest location.
Craig: And then we actually have a 2D position chart block that can be leveraged as a part of that. So, we can help you plot the XYs and make it really easy.
Scott: Yes.
Craig: So, awesome, thank you, Scott. So, one question we had about the particular solution at the event is: Scott, do you happen to know how often we were receiving data from the sensors to the gateway and then subsequently up to the Losant cloud?
Scott: No, I don't have the information as far as sensors to the gateway, but the gateway was reporting information up, I believe, every minute.
Craig: Okay, perfect. And that's something that's all adjustable. So, depending on your particular architecture, the solution, the problem you're trying to solve, each of those things can be adjusted with the specific end device, or sensor, in this case, the Rigado gateway, and then, you know, whether you're using Losant or any other cloud platform. It's something that ultimately is a way of determining what's best for your particular solution. All right, everyone. Well, with that, I think we've addressed each of the questions that came through. I know we're a little bit over time. I want to say thank you to everyone for joining us. For those of you who listen to the recording afterwards, we thank you as well. If you have any follow-up questions, please feel free to reach out to myself, craig@losant.com, or you can go to our website and hit the contact form there. We will route you to the right person to answer a question about what you’ve seen today. In a couple days you'll see a recording, and beyond that, I hope everyone has a wonderful day and we hope you join us the next time we have another webinar. Thanks, everybody.