
Data is the core of every IoT application. It is how enterprises learn where to cut costs, how to improve efficiency, and even where to innovate and create new products. But data on its own is meaningless. It’s all in how you make sense of it. The strength of your platform’s data processing, data collection, and data organization tools will allow your enterprise to harness data and use it effectively, saving time and money while increasing the value offered to customers.

Losant includes powerful Data Visualization features as one of its five core components. Perhaps the most obvious means in which Losant displays data is through its customizable dashboards, which allow you to take the mass of data your enterprise already pulls in and present it to your users in a way that makes sense. MachNation, in their MIT-E report, had this to say about Data in Losant “Data management is overall an area of strength for the Losant IoT platform."
Dashboards are very powerful tools. Let’s dive into the functionality and see how Losant Dashboards organize your data.
What is a Dashboard?
A dashboard in Losant allows you to display information relevant to your connected solution. Dashboards allow you to see changes and patterns in your data, monitor equipment, track shipments, and even see a map of available huddle rooms on a campus. Dashboards can be securely published internally or externally.
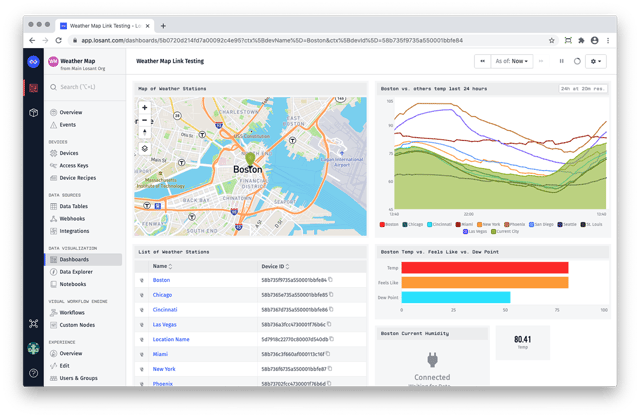
As you can see above, dashboards can display a wide variety of information. You can choose who has access to a dashboard and create different dashboards for different groups. For example, assume your company manufactures electrical generators for different hospitals. You can use design a dashboard that only displays equipment in a specific hospital. A technician can then log in and see a dashboard that displays only the equipment in their hospital.
How does a dashboard work?
Each dashboard in Losant is made up of one or more blocks. Blocks are windows that display a certain type of data in a certain way. For example, in keeping with the hospital example used above, you could add a block that displays the power level of each generator as a dial.
These blocks are customizable, both in the way in which they report data and the way in which they are presented on the dashboard itself. Dashboards are composed of numerous blocks, and as you add more, you may find you want to display them in a certain way. In Losant, you can drag a block with your mouse to anywhere on the dashboard, and resize these blocks by dragging the edges. You can see this in action below:
What Types of Data Can be Displayed?
There are numerous blocks available in dashboards, all of which allow you to display your data in a different way. Some of the most popular blocks are:
- Time Series Graph: Graphs one or more devices and their attributes over a custom time range.
- GPS Heatmap: Heatmap of the GPS positions of one or more devices at any point in time.
- GPS History: Displays the GPS history of one or more devices over a time period.
- Gauge: Displays the value of a single attribute.
- Pie Chart: A pie chart of one or more attributes.
- Bar Chart: A bar chart of one or more attributes.
Read more about the available blocks in the Losant Documentation on dashboards.
How can I see a Dashboard in Action?
Losant includes a Weather Station Application Template that is designed to show off many of the features of Losant in a functional environment, including dashboards. However, when you add the Weather Station Application Template, the dashboard will show no data. To populate the data, you can complete the Losant Walkthrough.
Display Your Data Clearly and Reap the Benefits
When you can easily view your data, you can make informed business decisions easier and with more confidence. Losant dashboards allow you to see the data you need, exactly how you want to see it.
Want to learn more about dashboarding? Take it for a spin in the Losant Developer Sandbox and learn more about Losant in Losant University.