
A number of improvements to the Losant platform went live today, chief among them being the new Dashboard Time Jumper. Want to know the state of your Things at a given point in time? Looking for an hour-by-hour progression of data so you can see what happened to your systems overnight? We've got you covered.
We've gotten a lot of feedback from our users about visualizing past data; our recently released Data Explorer was the first step toward providing this service. Now, with the Dashboard Time Jumper, you can go back to a specific date and time and view how your dashboard looked at that exact moment. So if you start your day by opening a Losant dashboard to check on your Things, and find that your Things went haywire at some point overnight, you can now look back in time across your entire ecosystem and pinpoint the exact moment where things turned sideways. Check out the Time Jumper documentation to learn more about using the feature.
Great to Hear! What Else Ya Got?
This is a big release, and in addition to the Dashboard Time Jumper, there are a number of other platform improvements going live. The majority of these updates come straight from user requests, so if you have any feature ideas or usability improvements, let us know in our forums!
Bottom-Docked Save Buttons
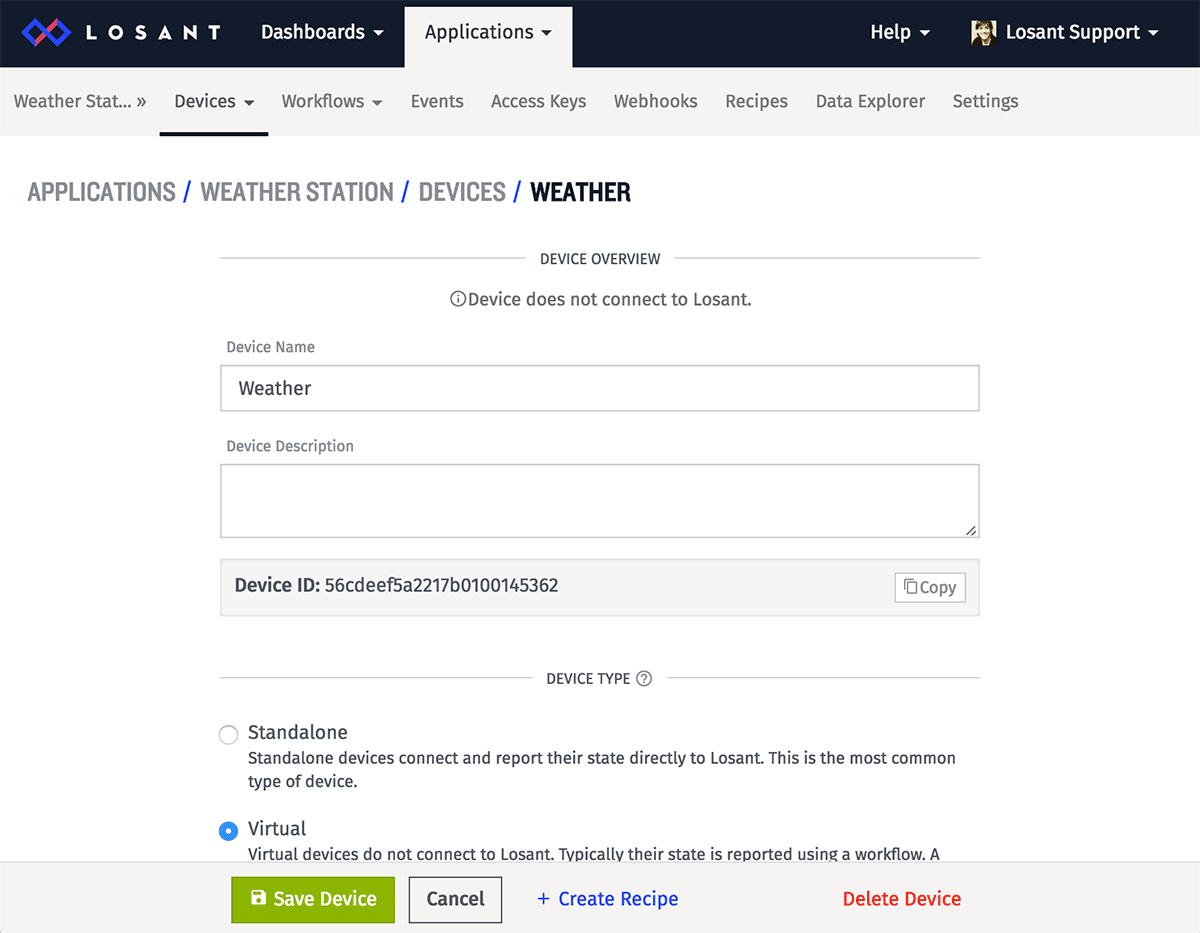
We admit it; we've been a little inconsistent with our placement of "Save", "Cancel" and "Delete" buttons throughout the app. But with this release, we've gotten our act together and placed the resource editing buttons in a predictable (and far more visible) location: the bottom of the viewport. And our "Cancel" buttons now send you back from whence you came instead of a specific link.
Input Controls Block - Helper Component
You can now add help text in the input controls block to explain in plain English what will happen when you fire off a workflow or device command from your dashboard. The component accepts Handlebars template tags as well as Markdown, so you can print out the current values of the block's other input controls and mark the important stuff in screaming bold orange.
Dashboard List Block
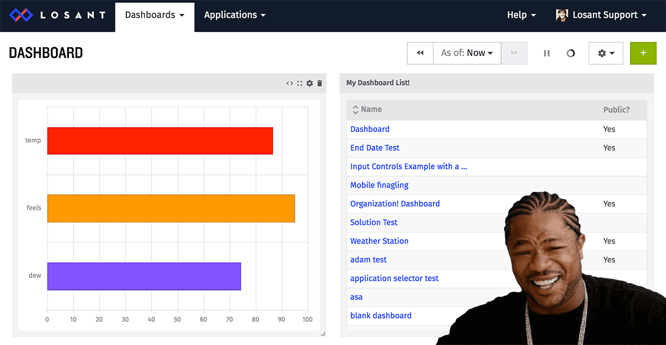
Yo dawg! I heard you like dashboards! So we put a list of dashboards in your dashboard so you can dashboard while you dashboard.
GPS Block Manual Centering
The GPS Heatmap and GPS History blocks now accept an optional "Default Center" argument, so that the map can be set to a specific viewport regardless of the data currently being displayed within it. You can also leave the field blank to fall back to the default behavior of centering the map to best fit your data set.
Device Exporting
Now you can export your application's devices from within the app. Look for the "Export" button on the "All Devices" page; clicking it will download a CSV containing the names, IDs, descriptions, class and tags of all your current application's devices.
Downloading Access Keys
We've added an option to download an access key and secret combination as a text file upon generation, in addition to the previous (and still in place) option of copying the key and secret to your clipboard individually.
Time Series Block Line Thickness
When "Line" is selected as the "Display Type" on the time series block, you can now change the thickness of each segment's line along with the line's color. This provides greater control over the graph's display and allows better visual grouping of attributes by color and level of importance.
What Next?
With every new release, we really listen to your feedback. By combining your suggestions with our roadmap, we can continue to make the platform easy for you. Let us know what you think in the Losant Forums.