
OpenPLC is a project that brings PLC-style programming (e.g. ladder logic) to a wide variety of non-PLC devices. It supports a wide range of popular boards including Raspberry Pi, Arduino, ESP8266, ESP32, and many more.
In this tutorial, we're going to use the Losant IoT Platform to create a cloud dashboard to easily visualize data from an OpenPLC device. Losant offers a free developer sandbox where you can try everything covered in this tutorial at no cost. There's no credit card required and you can sign up here.
OpenPLC Edge Compute Architecture
PLCs do not generally connect directly to the cloud. In most cases you'll require a gateway to act as a bridge between the local network and the cloud platform. For this example, the gateway is a Raspberry Pi running Losant's Gateway Edge Agent (GEA).

The GEA reads and writes variables on your OpenPLC device, performs any required edge logic, and then forwards telemetry data to Losant's cloud platform. The GEA can interface with any number of devices on the same network, so in most cases you'll only have a single gateway with this architecture.
The GEA is distributed as a Docker image, so you can use any gateway that supports Docker. The Raspberry Pi is our recommended gateway for prototyping and early POCs. Refer to Losant's GEA Installation and Usage documentation for details.
How to Communicate with an OpenPLC Device
One of the best things about OpenPLC is how it exposes variables to be read or written. Unlike other PLCs, which have proprietary protocols, OpenPLC directly maps your program's variables to Modbus registers. OpenPLC does support other protocols, but Modbus is the most popular and well supported.
Let's look at an example:
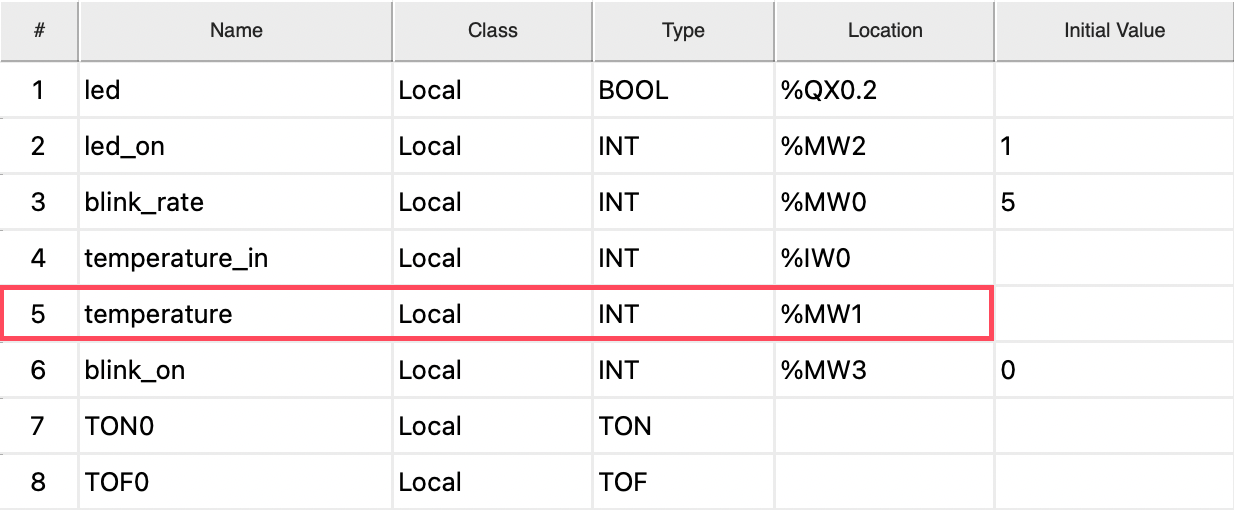
The table above is from OpenPLC's editor and contains the variables for our example program. The "Location" column controls addressing, or how each variable maps to an input, output, or memory location. To expose a variable over Modbus, you must set a location value, which is then automatically mapped to a Modbus register.
The highlighted "temperature" variable has a location value of "%MW1", which means:
- It is a memory location (M). This program is reading a temperature value from an analog input and then storing the result in this variable.
- It is a word (W), which is a 16-bit value.
- It is at index 1. For memory locations, you can choose any index you want. Other types of variables, like inputs and outputs, have specific values that map to pins on whatever board you're using.
Now if we look at OpenPLC's Modbus addressing page, we can see how the location value of "%MW1" maps to a Modbus register:

There are multiple tables on this documentation page, so make sure you're inspecting the one relevant to your device. The device being used in this tutorial is a NodeMCU (ESP8266), which is a memory-constrained device. At the time of writing, memory-constrained devices are covered in the second table.
Looking at the highlighted row in the screenshot above, we can see that 16-bit memory addresses (%MW0-%MW19) are mapped to holding registers 32-51. This means our temperature value (%MW1) can be accessed by reading holding register 33 (%MW0 = 32, %MW1 = 33, %MW2 = 34, etc.).
Lastly, you must enable the Modbus TCP interface when transferring the program to your device.
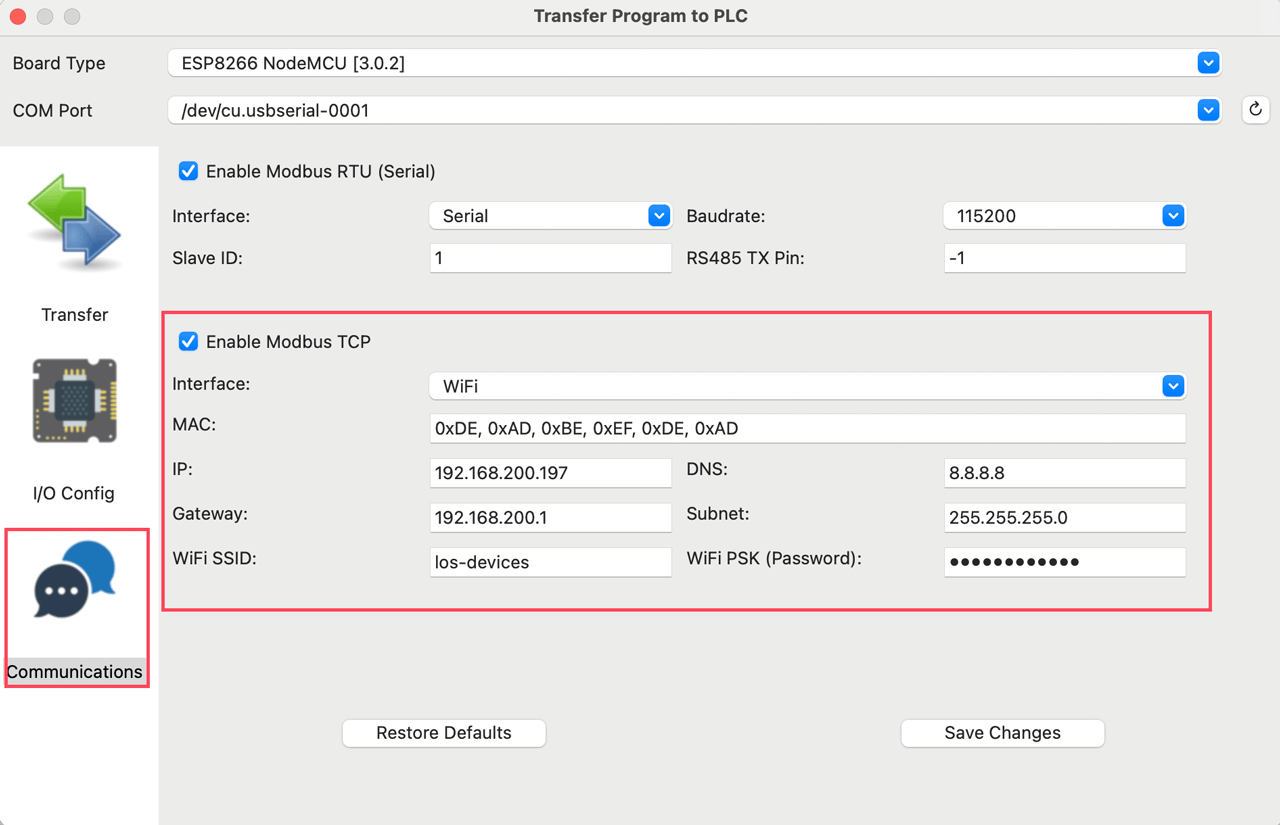
This is another great feature of OpenPLC. When it compiles the program for your device, it automatically adds all required code to connect to your WiFi (or Ethernet) network.
Below is a screenshot of the PLC program used in this example. It's reading temperature from an analog input and has also exposes the ability to control an LED. Your program will be different and will have different variables, so we're not going to go into details about how this program works. The most important concept for this tutorial is how to use "Location" to expose your program's variables over Modbus.
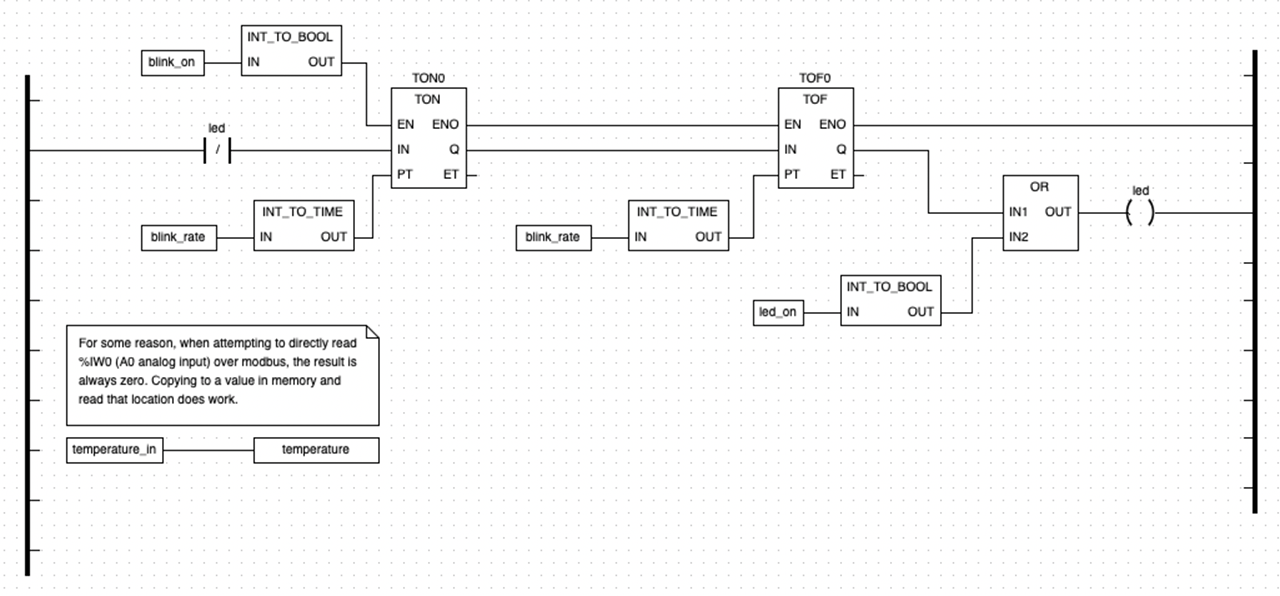
Once the program is transferred to your device, it will automatically connect to WiFi and be accessible over Modbus TCP. We can now move on to reading and writing those Modbus registers using Losant's Gateway Edge Agent.
Accessing Modbus Data Using the Losant Gateway Edge Agent
The Losant Gateway Edge Agent runs workflows that are designed in the cloud using a drag-and-drop editor and then deployed to gateways running in the field. The GEA has built-in nodes for many industrial protocols, including Modbus.
Let's start with reading our temperature data. As described above, the temperature variable has its location defined as "%MW1", which maps to the Modbus holding register 33.

The workflow pictured above reads the temperature value every minute and then reports that value to Losant's cloud platform where it can be displayed on a dashboard. You can download this workflow here and import it into your own application as a new edge workflow to view the full details. Here's a high-level overview of what each node is doing:
- The Timer Trigger fires this workflow once per minute.
- The Modbus: Read Node, which is highlighted in red, reads our temperature data. The configuration for this node is displayed on the right. It requires the IP address of the OpenPLC device and one or more registers to read. For this example, we're reading a holding register at address 33.
- The Conditional Node is checking for errors. The Modbus: Read Node can fail for many reasons (device not found on network, invalid Modbus register, etc.). If any errors occur, the read node will place them on an "errors" field as part of its result. This node is making sure the "errors" field is undefined.
- The Math Node is converting the raw analog input value (0-65535) to a voltage range (0-3200mv) and then finally to a temperature value. These calculations will be different depending on the board and sensor you're using.
- The Device: State Node is reporting the temperature data to the Losant Platform. All time-series telemetry data is stored on Device Attributes. In this example, our OpenPLC device has a single attribute named "tempC". All data reported to attributes is automatically stored in Losant's time-series database and easily viewed using Losant Dashboards.
Once this workflow is deployed to our Raspberry Pi gateway, the timer will begin executing and our temperature data will be reported to the platform every minute. We can now move on to visualizing this data using Losant Dashboards.
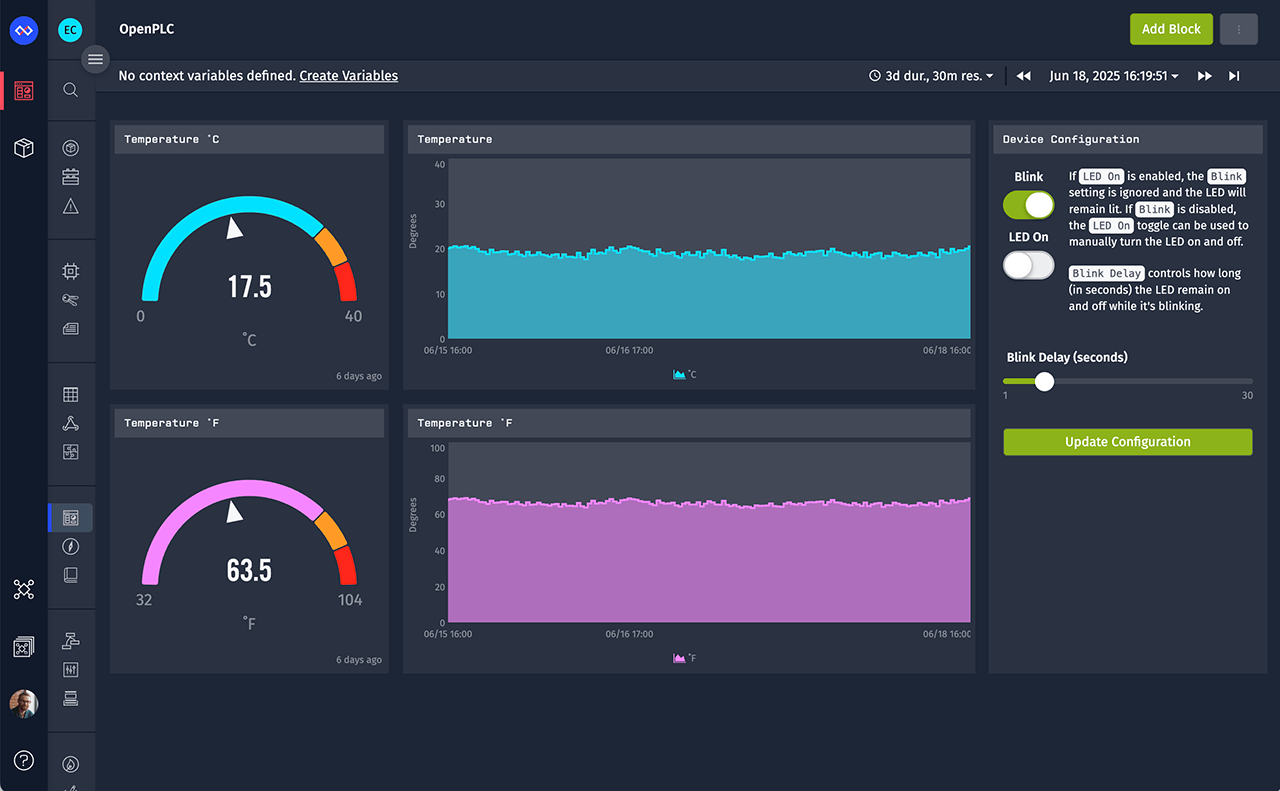
Visualizing OpenPLC Data Using Losant Dashboards
The above dashboard has two Gauge Blocks to display the temperature in both Celsius and Fahrenheit. It also contains two Time Series Graphs to display the temperature values over time.
The Input Controls Block is used to send commands back to the GEA to control the OpenPLC device. We're not going to cover controlling OpenPLC devices in this tutorial, but it's done very similarly to reading variables. Instead of the Modbus: Read Node, you use the Modbus: Write Node to change the values of your variables.
Let's start with the Celsius gauge block (top left). It has the following configuration:

- The Duration is set to "Last received data point". This means the gauge will always display the most recently received data. If needed, you can choose longer durations and aggregate multiple data points together. This is useful if you want to, for example, see the average temperature over the last 24 hours.
- The Device dropdown is set to our OpenPLC device. This is the same device that we're reporting data to from our edge workflow.
- The Attribute dropdown is set to "tempC". This is the attribute that is receiving our temperature data.
- The Aggregation value does not apply since our duration is set to "Last received data point". If we selected a longer duration, this controls how the data in that window of time are combined (mean, max, min, etc.).
- The Gauge Type controls this visual style for this block. For this example we've selected "Needle".
- The Label controls the small text that's displayed under the value. This is usually set to the units and in this example is set to "˚C".
- The Min and Max values control the visual range of gauge. Since this sensor is indoors, we don't expect the value to exceed a range of 0-40 degrees.
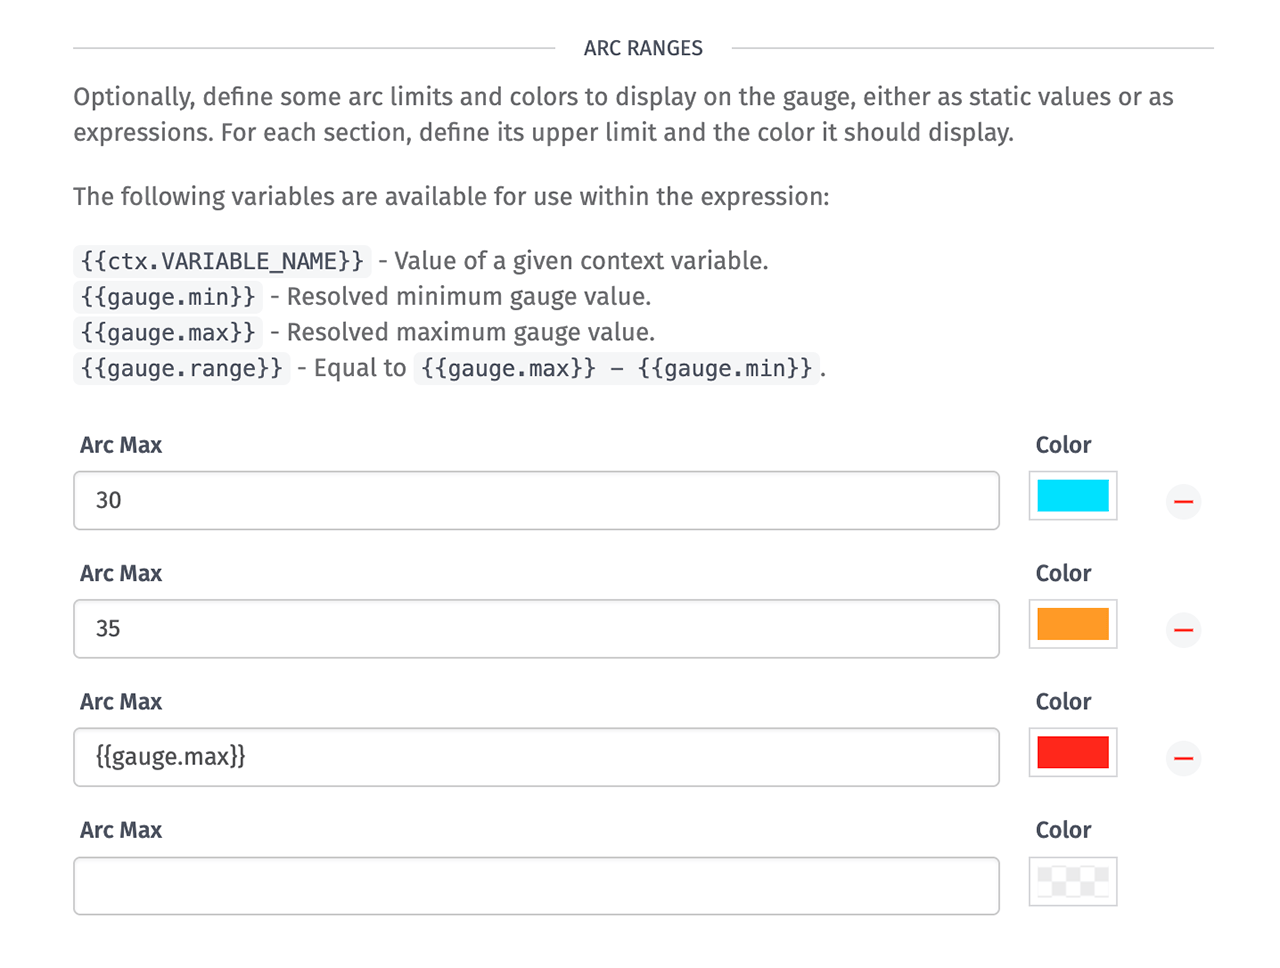
Lastly, the needle gauge supports custom color values at different places along the arc. These are usually set to indicate some kind of warning or error thresholds. For this example, we want the arc to be yellow between 30-35 degrees Celsius and then red for anything above 35 degrees.
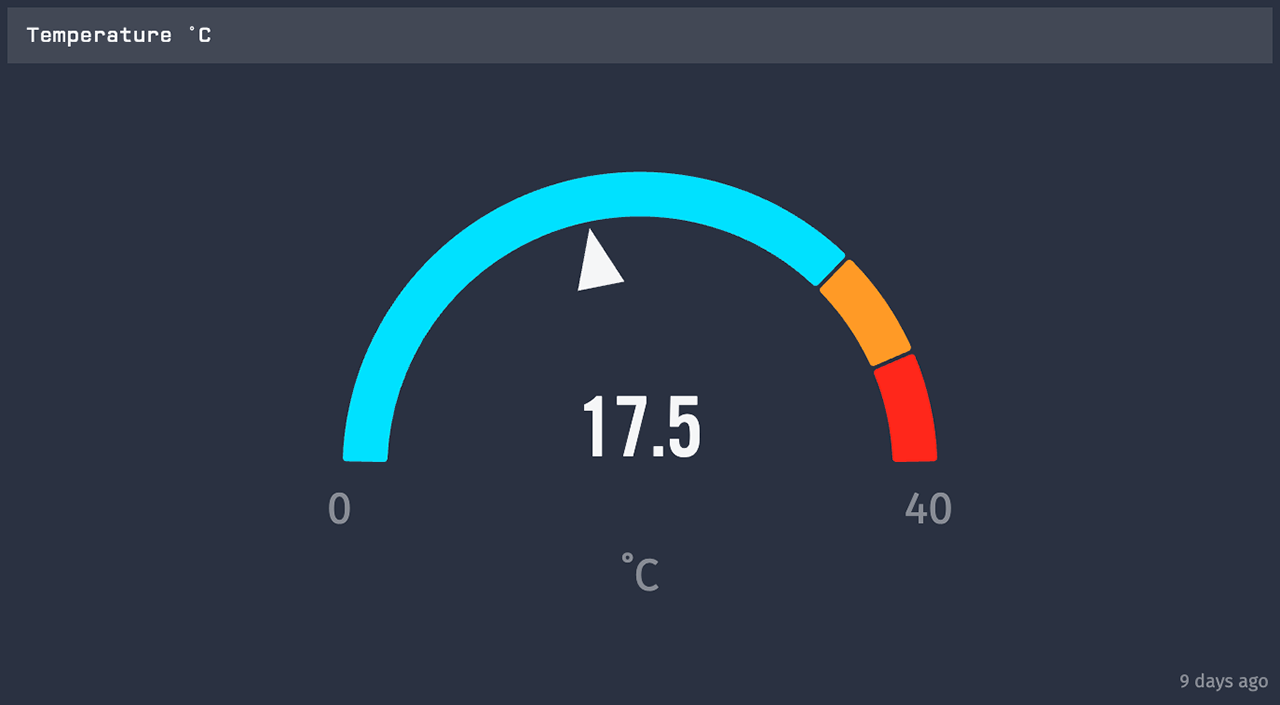
This results in a gauge block that looks like this:
Our device only has a "tempC" attribute, so to graph the temperature in Fahrenheit, we're going to clone this block and add a Data Transformation to the cloned block to do the conversion.

Data transformations accept expressions, which are math formulas that support a wide variety of operations. In the screenshot above, you can see that we've provided the formula for converting Celsius to Fahrenheit. The only other things you'll want to change on the cloned block is the header text, the label (from "˚C" to "˚F"), and the min and max values. You've now got two separate gauge blocks displaying data from the same underlying attribute.
Let's now move on to the Time Series Graphs.

Time Series Graphs have a Duration (how much time should the entire graph represent) and a Resolution (how much time should each data point represent). In this example, they're set to "Dashboard Duration" and "Dashboard Resolution". This means they're using the global duration and resolution values. This is convenient when you have multiple graphs on the same dashboard and you'd like change these values for every graph at once. You can, however, set these to specific values if you require more control over how your data is being displayed.
All graph data is displayed in one or more segments. For this example, we only have one device and one attribute, so we only require one segment. Aggregation is set to "Mean" and applies whenever the resolution spans more than one data point. For example, since we're receiving data every one minute, a resolution value of 1 hour will result in 60 data points being averaged together.
Most of the other fields (Series Label, Display As, Line Wt. etc.) control the visual style of the graph and you can set those based on how you'd like this data displayed.
Lastly, you must configure one or more Y axes and select which axis to use for this segment using the Y Axis dropdown. Here's the axis configuration for this dashboard:

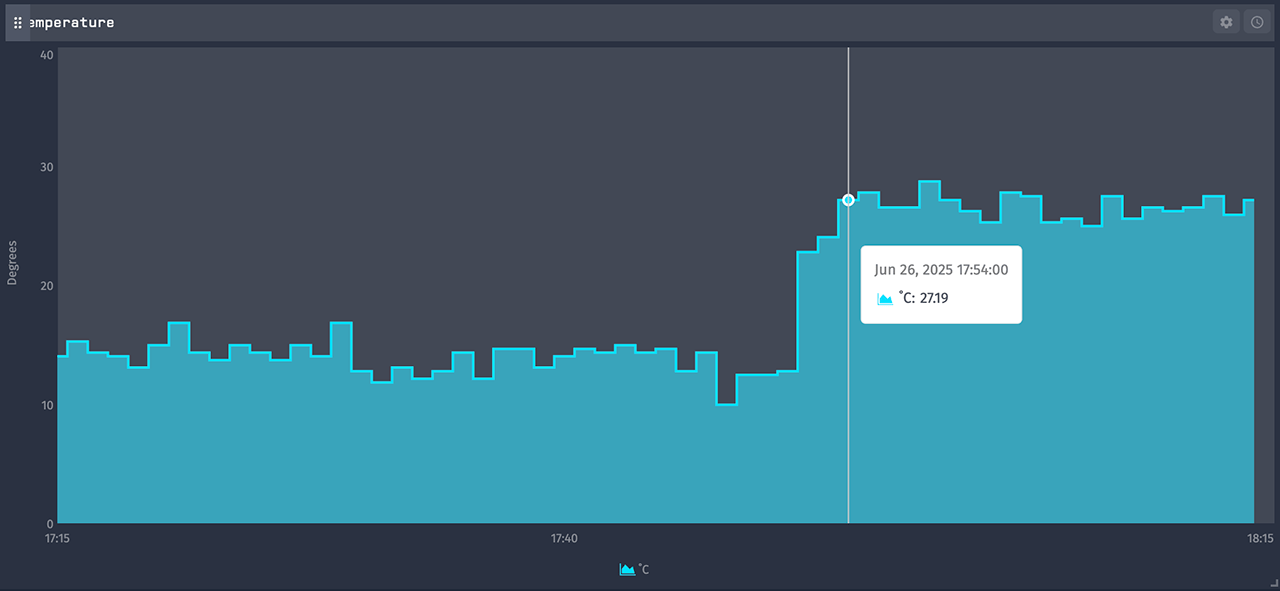
The Label value is set to degrees and we've set the Min and Max to match the gauge block (0 and 40). All other fields are left as their default values. This results in the following time series graph:
To get the Fahrenheit version of this graph, we can repeat the same process we did for the gauge block. Clone this graph, set a data transformation, and change the labels. We'll leave that as an exercise for you.
With that, we've got a completed dashboard displaying the real-time and historical data from our OpenPLC device. There are many other types of blocks that can display many types of data.
PLCs usually have dozens (or hundreds) of variables. A single Losant device can support 256 attributes, so there's plenty of room to support your use case. No matter what your OpenPLC device is reporting, Losant can help visualize its data.
Build an OpenPLC-Powered Connected Product
We've barely scratched the surface of the Losant IoT Platform. With Losant Experiences, you can build completely customized connected products on top of your OpenPLC devices. If you're an OEM, systems integrator, or manufacturer using OpenPLC as part of your technology stack, please contact us to see how Losant can help accelerate your IoT initiatives.