
Welcome back to our two-part tutorial providing step-by-step instructions for configuring a Teltonika RUT240 to read Modbus data and report that data to the Losant Enterprise IoT Platform over MQTT.
In part 1 we learned how to perform the initial setup of a Teltonika RUT240 and how to update its firmware. We also learned how to install the Modbus packages that are required to collect data from our equipment.
In this part we’re going to cover how to transmit Modbus data over MQTT to Losant’s platform where it can be stored, visualized, and used to deliver IoT connected products to your customers.

Reporting Modbus Data to an MQTT Broker Using the Teltonika RUT240
At this point, we’ve successfully configured our RUT240 to periodically request all required Modbus data. We can now configure the Data to Server service to forward Modbus data to an MQTT broker. For this tutorial, we’ll be using Losant’s built-in MQTT broker, however these concepts will apply to most other brokers.
If you don’t already have a Losant account, feel free to sign up for a free Developer Sandbox account, which provides plenty of resources for this tutorial. If you’re new to Losant, we recommend following the Weather Walkthrough to learn many of Losant’s core concepts.
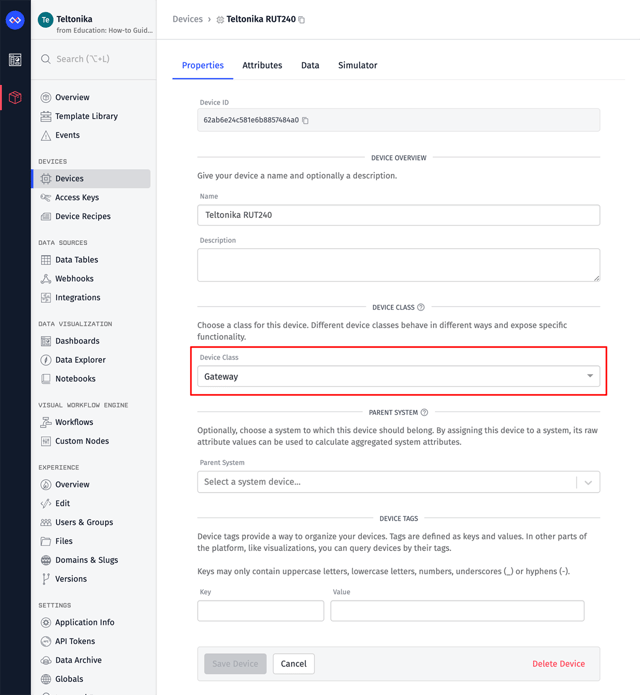
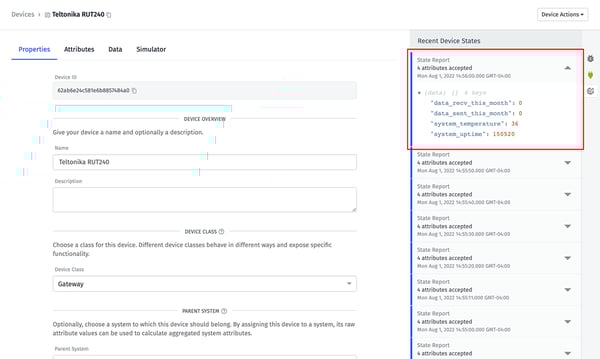
In Losant, devices authenticate against the MQTT broker using a device ID and an access key. So the first thing we need to do is create a device to represent our RUT240. Since the RUT240 device is reporting data on behalf of other devices, we made its device type a gateway. This allows us to associate any number of peripheral devices to our RUT240 and allow the gateway to report on their behalf. This association will be important in the later sections as a way to identify the device for which we’ve received data.
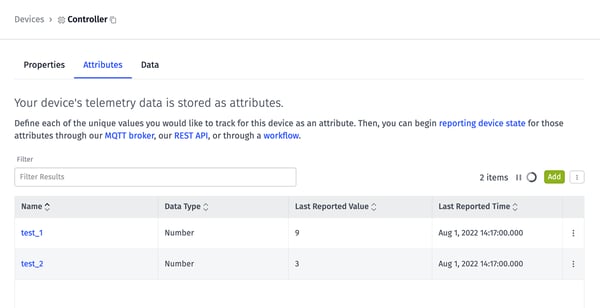
Next, we need to add attributes to this device. In Losant, attributes hold a device’s telemetry (i.e. time series) data. We’re going to name our attributes to match what we named our Modbus requests. This will make it easier to associate incoming data to device attributes.
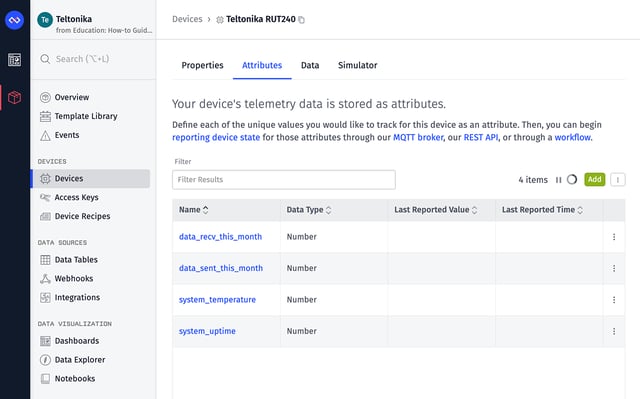
When we configured the Modbus TCP Master service for the RUT240 device, we configured four requests. As shown in the screenshot above, the attribute names are identical to those request names.
We can now create an access key for this device.
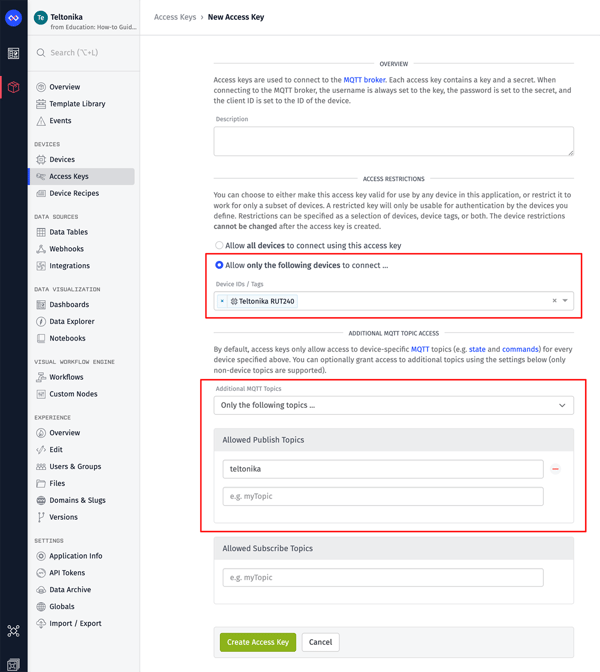
For security best practices, we recommend creating a unique access key per device, which is why this access key is restricted to just the RUT240. Access keys also control which MQTT topic(s) a device is allowed to access. In this case, we’re going to configure our RUT240 to publish data on the teltonika MQTT topic. This means we need to grant publish access to this additional topic in the access key configuration.
When you click Create Access Key, you’ll be presented a modal displaying the newly created key and secret. Losant does not store the secret, so it’s important that you copy/paste or download these values somewhere safe.
Returning to the RUT240’s WebUI, we can now configure the Data to Server service. Navigate to the Data to Server configuration page and click the Add button to add a new Data Sender. This will bring up a modal to configure the sender.
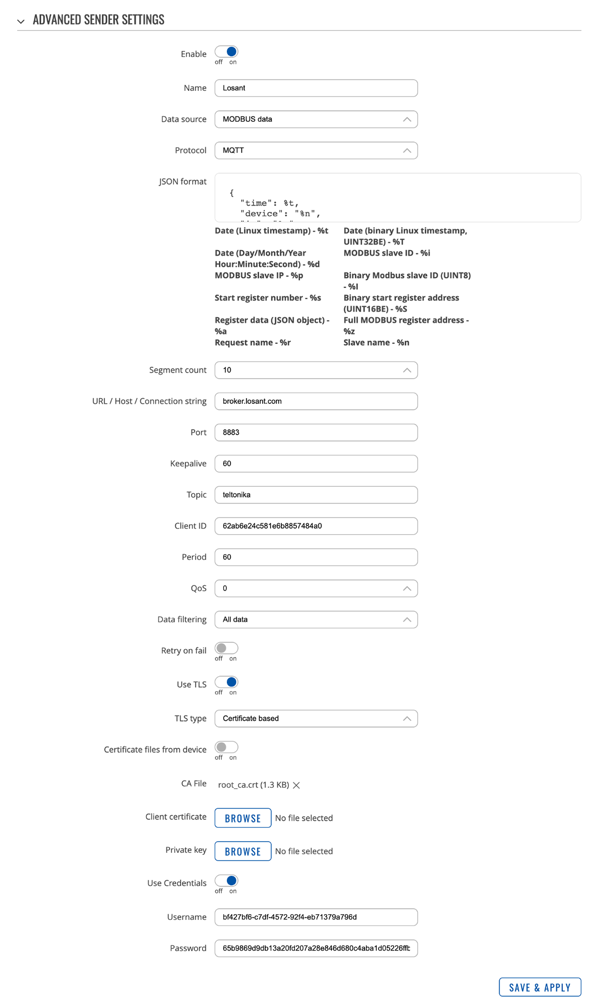
The screenshot above shows the configuration used by this tutorial. The fields that are specific to Losant are described below. For details of what every field does, please refer to the Data to Server documentation.
- Segment Count: Determines how many data points (i.e. individual Modbus requests) to include in a single MQTT payload. To reduce the number of overall MQTT messages, we’re setting this to the maximum value of “10”.
- URL / Host / Connection String: Set to “broker.losant.com”, which is the URL for Losant’s MQTT broker.
- Port: Set to “8883”, which is the TLS (encrypted) port for Losant’s MQTT broker.
- Topic: Set to “teltonika”, which matches the additional topic we granted to the access key.
- Client ID: Set to the ID of the Losant device representing the RUT240.
- Use TLS: Set to “on” so that all data is encrypted in transit.
- CA File: Used by the device to validate Losant’s server certificate. Losant's certificate is signed by the DigiCert Global Root CA.
- Use Credentials: Set to “on” so that we can provide the device’s access key and secret using the MQTT username and password fields.
- Username: Set to the value of your device’s access key.
- Password: Set to the value of your device’s access secret.
As for the JSON format, we’re using this template:
{
  "time": %t,
  "device": "%n",
  "ip": "%p",
  "data": { "%r": %a }
}
There are several variables available and they’re all described on the modal under the text field. For this tutorial, we’re adding the time, the device’s name, the device’s IP, and putting the actual Modbus request value under the data property.
Since this RUT240 can report data for any number of Modbus devices, we’re using the IP as a way to look up the corresponding Losant device when data is received by the platform. This service reports individual Modbus requests as separate messages. By adding the time property, we can combine multiple requests together and report them as a single device state report in Losant. This will all be covered in the next section.
Once you click Save & Apply, the RUT204 will connect to Losant’s MQTT broker and start sending all the Modbus data that has been collected. If the RUT240 has been collecting Modbus data for a while, it will attempt to send all of it to Losant at once, which may result in the device being disconnected due to exceeding the rate limit. The device may repeat this cycle a few times, but it will eventually catch up, at which point you’ll see a stable connection and data being received by Losant every 60 seconds.
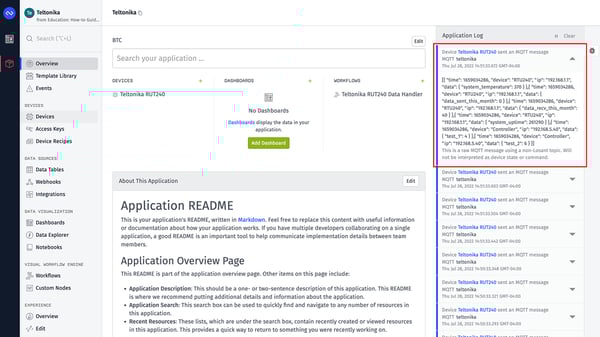
You can monitor incoming data using the application communication log.
The configuration for the RUT240 is now complete. For this tutorial, we configured the RUT240 over the local network, however Teltonika does provide a Remote Management Service (RMS). For large-scale deployments where you may have hundreds or thousands of fielded RUT240 devices, the RMS provides an excellent tool to remotely configure a device already deployed to a customer’s site.
We’re now successfully transmitting Modbus data to Losant’s MQTT broker. It’s now time to decode this data, store it on device attributes, and visualize the data using Losant dashboards.
Decoding and Visualizing Modbus Data From the Teltonika RUT240
Before we begin decoding this data, we need to complete the device configuration within the Losant platform. We’ve already created the device for the RUT240, but we haven’t created the peripheral device to represent our industrial controller.
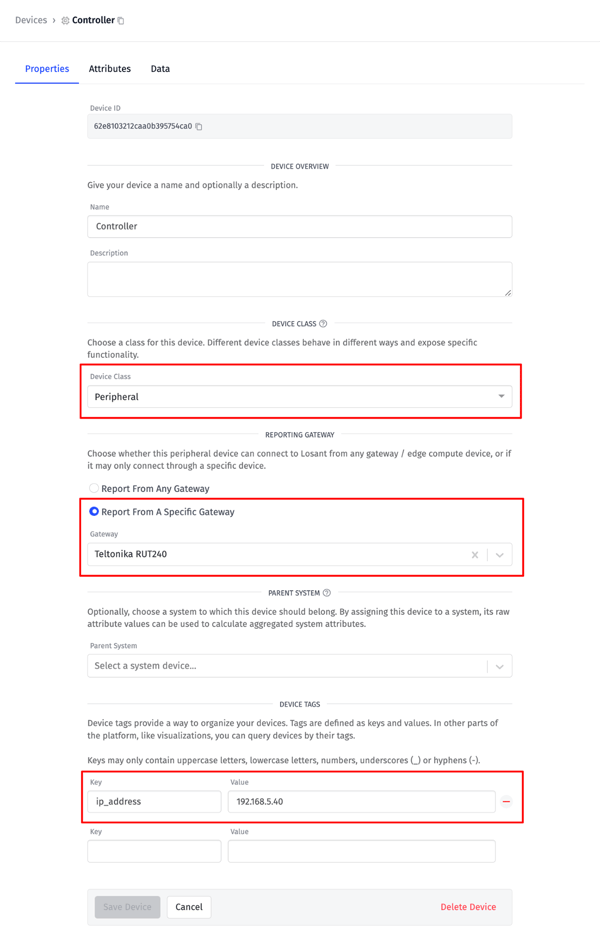
For the controller device, the Device Class is set to Peripheral and configured to report from the RUT240 gateway device. Lastly, the device is tagged with its IP address. As we begin receiving data, we’ll be able to use the gateway/peripheral association and the IP address to unique identify this device. This architecture provides a way to have multiple RUT240 devices, at different customer sites, all reporting data to Losant at the same time.
This device also needs two attributes to match the two Modbus requests we configured previously ( test_1 and test_2).
The last thing we need to do before continuing is to tag the RUT240 device with its IP address, which by default is 192.168.1.1.
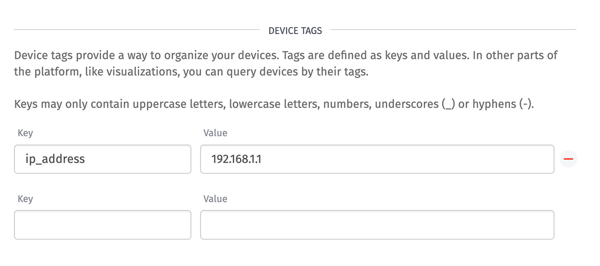
Since the RUT240 is reporting data for itself, we need this tag to know which data belongs to it versus one of its peripherals.
We now have everything in place to begin decoding and storing the Modbus data being reported by the RUT240. The first challenge is that the RUT240 is sending Modbus values as separate JSON objects. Many of these values were read at the same time and for the same device. Therefore, we need to group and combine values together.
For example, here’s the raw data received from the RUT240:
[
  {
    "data": { "test_1": 10 },
    "device": "Controller",
    "ip": "192.168.5.40",
    "time": 1659371825
  },
  {
    "data": { "test_2": 4 },
    "device": "Controller",
    "ip": "192.168.5.40",
    "time": 1659371825
  },
  {
    "data": { "system_temperature": 360 },
    "device": "RUT240",
    "ip": "192.168.1.1",
    "time": 1659371825
  },
  {
    "data": { "data_sent_this_month": 0 },
    "device": "RUT240",
    "ip": "192.168.1.1",
    "time": 1659371825
  },
  {
    "data": { "data_recv_this_month": 0 },
    "device": "RUT240",
    "ip": "192.168.1.1",
    "time": 1659371825
  },
  {
    "data": { "system_uptime": 142185 },
    "device": "RUT240",
    "ip": "192.168.1.1",
    "time": 1659371825
  }
]
This particular payload includes six Modbus values. Two of the values are for the Controller device and four are for the RUT240. All data points have the same timestamp. We need to reshape this data so that values collected at the same time for the same device are grouped together and reported as a single device state message.
For example, the reshaped data for the RUT240 data points looks like the following:
{
  "time": 1659371825,
  "data": {
    "system_temperature": 36,
    "data_sent_this_month": 0,
    "data_recv_this_month": 0,
    "system_uptime": 142185
  }
}
We’re doing this primarily for scalability reasons. Losant enforces a two-per-second-per-device rate limit on state data. If we’re reporting each state message individually, we’ll quickly exceed this limit. By combining data into larger, but fewer, messages, we’ll end up with a data architecture that scales better.
This tutorial provides a high-level overview of the Losant Workflow that does this protocol transformation. For more details, you can download this workflow, import it into your own application, and explore each node for yourself.
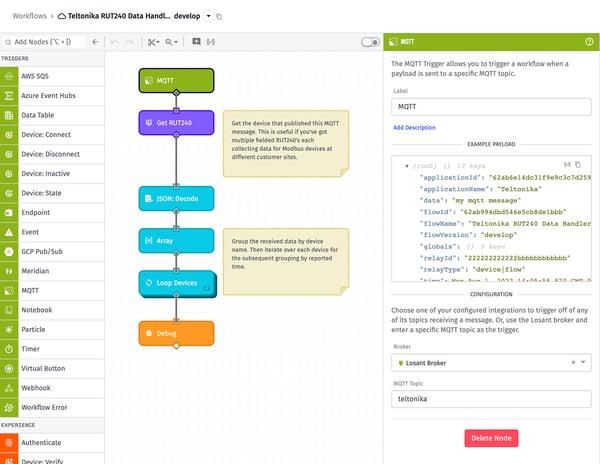
This workflow is triggered on any data published to the teltonika topic. The implementation provided by this tutorial supports receiving data from multiple RUT240s, each associated with multiple peripherals. Therefore, the first thing we do is use a Device: Get Node to get the full device object representing the specific RUT240 that published this message.
The incoming data can include up to 10 values (this is the maximum as configured in the Data to Server service). These 10 values can include data for multiple different Modbus devices. So we need use an Array Node to group the incoming data by the device name (the device name is included in the payload sent from the RUT240).
Next, we use a Loop Node to iterate over each device.
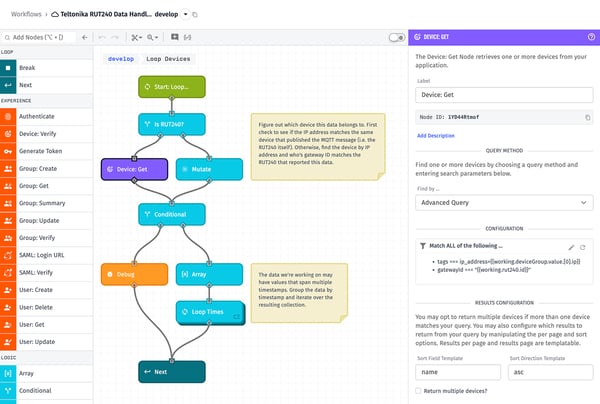
Within each iteration, the first thing we do is find the matching Losant device. We first check to see if the incoming IP address matches the IP address of the RUT240 that published the data. If it matches, we know we are working on the RUT240’s Modbus data. If it doesn’t match, we then query all devices that are peripherals of the RUT240 to find the one with the matching IP address. This gateway/peripheral association is important because two pieces of equipment at two different customer sites could have the same IP address. By scoping our query to peripherals of the RUT240 that published the data, we’re guaranteed to find the correct device.
At this point we have all data points grouped together for the same device. However, these data points could have different timestamps. The Data to Server service has a configurable reporting interval and if the interval is longer than the Modbus read interval, you will receive multiple values for the same Modbus request collected at different times.
Therefore, this loop iteration ends by subgrouping our data by timestamp and then iterating over each of those resulting groups. We now have a collection of Modbus values that were reported at the same time for the same device.
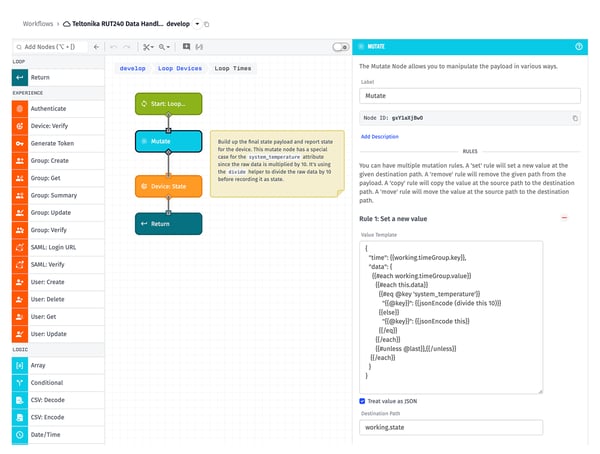
Inside this loop, we’re using a Mutate Node to transform our array of individual values into a single device state payload that can be directly reported using the Device: State Node.
The template we’re using is the following:
{
  "time": {{working.timeGroup.key}},
  "data": {
    {{#each working.timeGroup.value}}
      {{#each this.data}}
        {{#eq @key 'system_temperature'}}
          "{{@key}}": {{jsonEncode (divide this 10)}}
        {{else}}
          "{{@key}}": {{jsonEncode this}}
        {{/eq}}
      {{/each}}
      {{#unless @last}},{{/unless}}
   {{/each}}
  }
}
The resulting object looks something like this:
{
  "time": 1659371825,
  "data": {
    "system_temperature": 36,
    "data_sent_this_month": 0,
    "data_recv_this_month": 0,
    "system_uptime": 142185
  },
}
The above template has a special case for the system_temperature attribute. This is because that specific Modbus value comes from the device multiplied by 10. To convert it back to an actual temperature, we’re using the divide helper to divide it by 10.
Once this workflow is deployed, state data will begin showing up for your devices.
When state data is reported to device attributes, it’s automatically stored in Losant’s time-series database and available for display on Losant’s Dashboards.
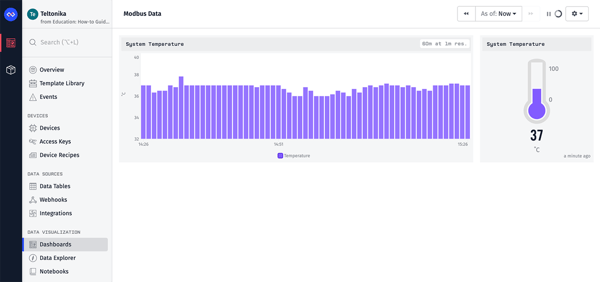
Since Losant’s dashboards are drag-and-drop and fairly intuitive for new users, this tutorial is not going to provide step-by-step instructions. If you’d like a tutorial for building dashboards, we recommend following the Losant Walkthrough.
Bring Your IoT Connected Product to Life
We’ve barely scratched the surface on Losant’s capabilities when it comes to delivering customer-facing industrial equipment monitoring applications. Losant’s End-User Experiences functionality brings your devices, data, and customers together with multi-tenancy, user management, and fully branded user interfaces.
Losant has helped some of the largest organizations in the world deliver IoT to their customers. To learn how Losant can help your organization transform your equipment into IoT connected products, please contact us.