
Every IoT platform supports standard sensor data. These are things like temperature, voltage, or RPM. When it comes to more complex data, like images, most platforms either don’t support it or require complex workarounds. With today’s release of Blob Attributes, Losant now provides some of the most complete support for binary and image data that you can find in an IoT platform.
Today’s update includes:
- Blob Attributes: Report and store arbitrary binary data.
- Time at Value Aggregation: Calculate the amount of time an attribute was equal to a value.
- MQTT Broker at the Edge: Support local MQTT connections to the Losant Edge Agent.
- Other Updates: A collection of smaller features, most of which come directly from your feedback.
Handling IoT Image Data with Blob Attributes
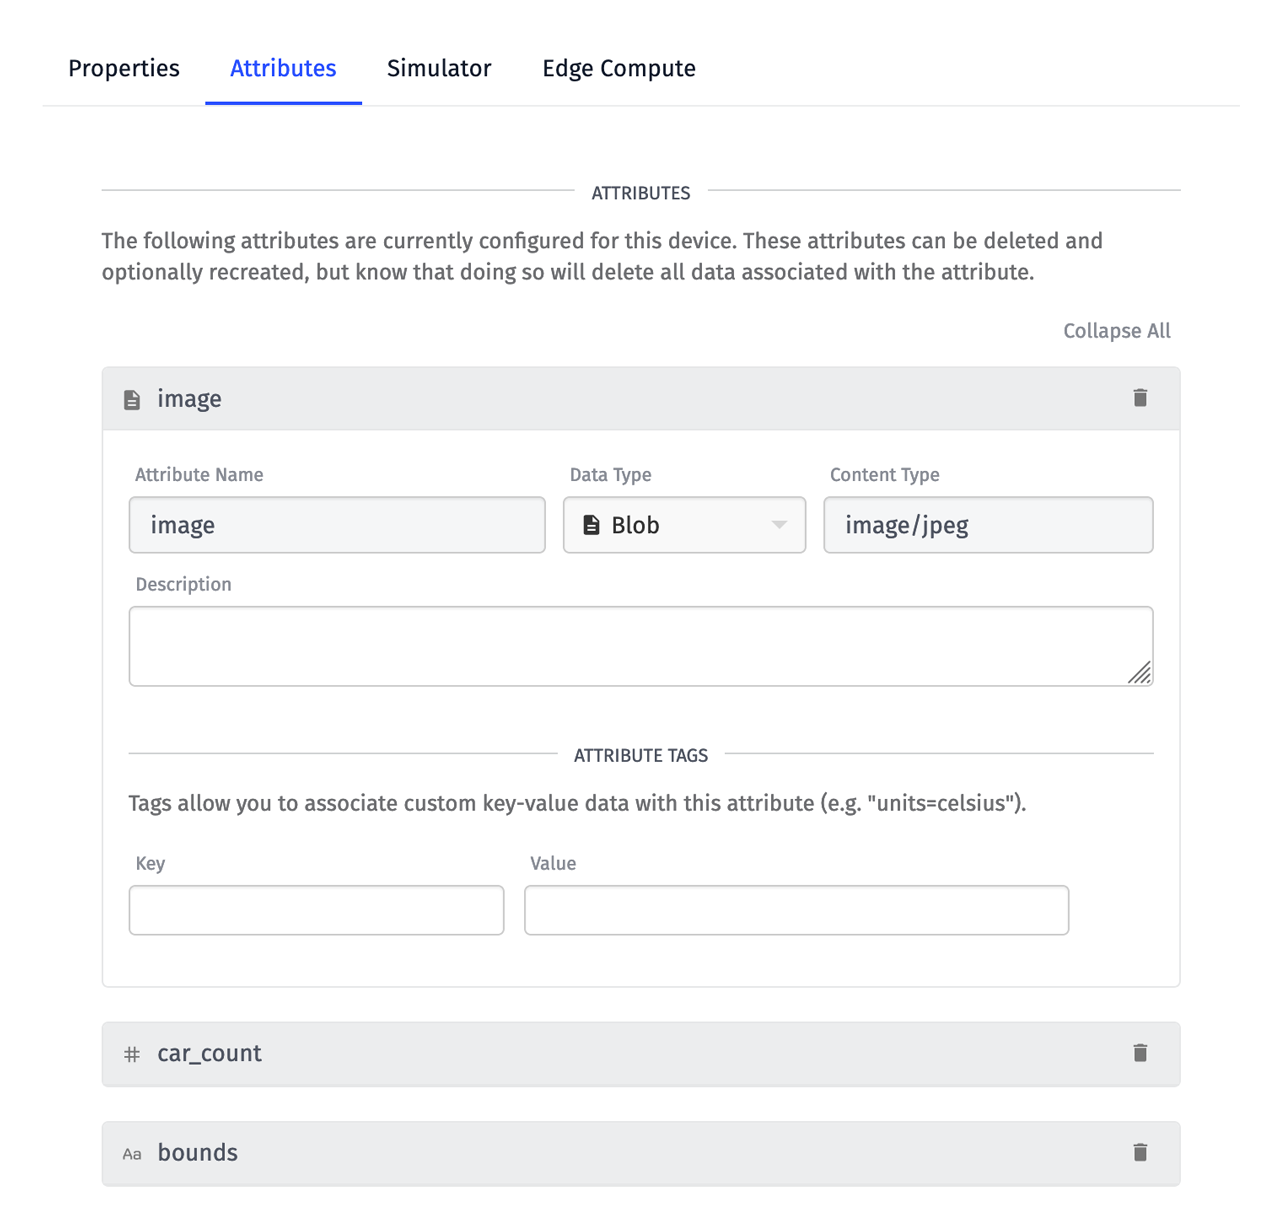
Binary Large Object (blob) data refers to any arbitrary chunk of binary data. In the database world, blob fields are commonly used to store images and other data that don’t fit in a predefined set of data types (e.g. number, string, boolean, etc.). With today’s update, Losant has adopted this concept with the addition of Blob Attributes.
Although blob attributes can be used to store any binary data, the primary use case is to support images. Images are an increasingly important data source for many IoT solutions, which include:
- Visual quality inspection in manufacturing
- People counting and occupancy detection for smart environments
- Visual inventory monitoring in warehousing and logistics
- Vehicle tracking for parking availability and utilization
To learn more about object detection for vehicle monitoring, see Analyzing IoT Image Data using Losant and the Google Vision API.
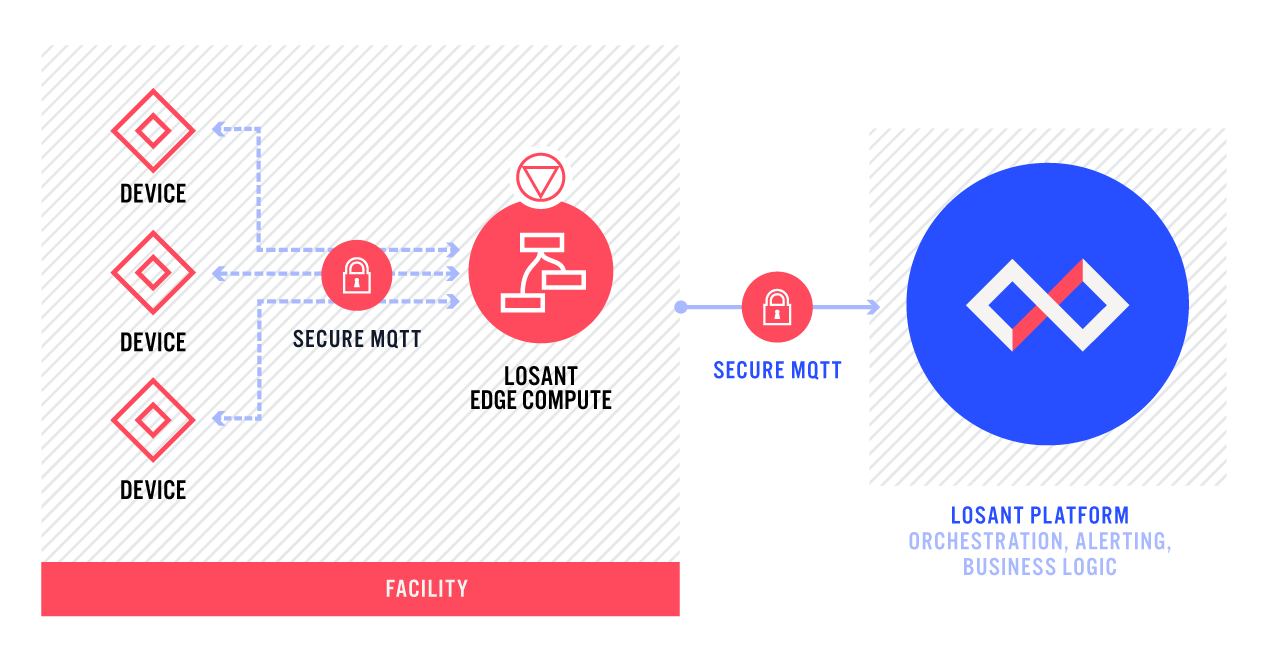
Blob data works slightly differently than other attribute data within Losant. The following diagram shows how blob data is received and processed by the platform:
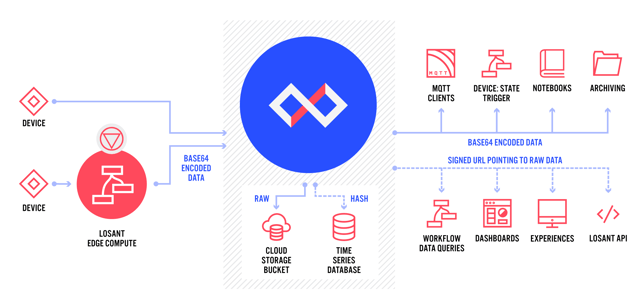
Blob data is reported just like any other attribute, except the data must first be encoded as a Base64 string. Losant has built-in helpers to both encode and decode Base64 data.
Because blob data is generally much larger than regular attribute data, storing it in Losant’s time series database would not provide a scalable solution. Instead, the raw data that you report is placed in a cloud storage bucket, which is optimized for blob data. The time series database then receives a hash of the data to mark the moment in time. All of this work is done behind the scenes to provide a scalable solution for your data.
As part of this release, we’ve also added direct support for blob data in the Image Block. This addition makes it easy to display images that are being reported on your blob attributes.
In most cases, when accessing blob data after it’s been reported, you will receive a signed URL that points to the raw data. If the blob data represents an image, this URL can go directly into an HTML image element. If the blob represents custom binary data, this URL can be used to download the data, either using the HTTP Node or the Custom HTML Block. That raw data can then be processed or visualized in any custom way.
If you’re a developer and want to begin experimenting with image data, see the tutorial How to Access the Raspberry Pi Camera from the Losant Edge Agent.
Calculate Equipment Availability with the Time at Value Aggregation
Performing aggregations on time series data has been a core feature of Losant since we originally launched. Losant has long supported common aggregations like mean, medium, sum, standard deviation, count, and others. While these aggregations can be used to derive a large number of insights from time series data, we’ve received a number of requests that revolve around a similar question:
How long has an attribute been equal to a specific value?
This is a question that can now be answered using the new Time at Value aggregation. Given an attribute and a value, this aggregation will return the amount of time, in milliseconds, that the attribute was equal to that value.
Below is a diagram with example data that shows how this aggregation works:
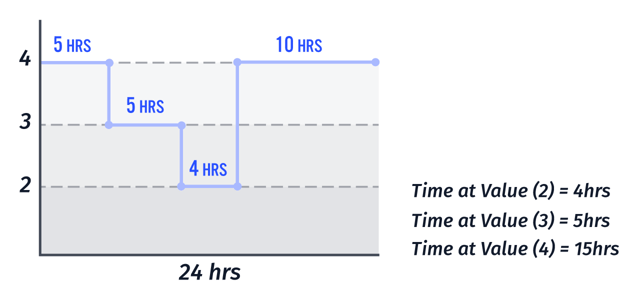
As shown in the diagram above, an attribute’s value is changing between 2, 3, and 4 over a 24-hour period. The Time at Value aggregation can be used to calculate the amount of time the attribute was equal to 2, 3, or 4 over this 24-hour period, which equals 4 hours, 5 hours, and 15 hours respectively.
This aggregation was specifically designed to enable the calculation of equipment availability as part of an Overall Equipment Effectiveness (OEE) use case. This can be achieved by adding a status attribute to your Losant devices that is set to values like “running,” “stopped,” “maintenance,” “faulted,” etc. The Time at Value aggregation can then be used to calculate the amount of time your equipment was “running” compared to the amount of time your equipment was “stopped” or “faulted.”
Availability is not the only use case this aggregation solves. There are many other use cases that you’ve asked for that this aggregation helps. These include:
- How long has my device been charging?
- How long has my device been connected vs. not connected? This will require storing the connected status on a device attribute.
- How long has this conference room been empty vs. occupied?
- How long has this water tank been empty?
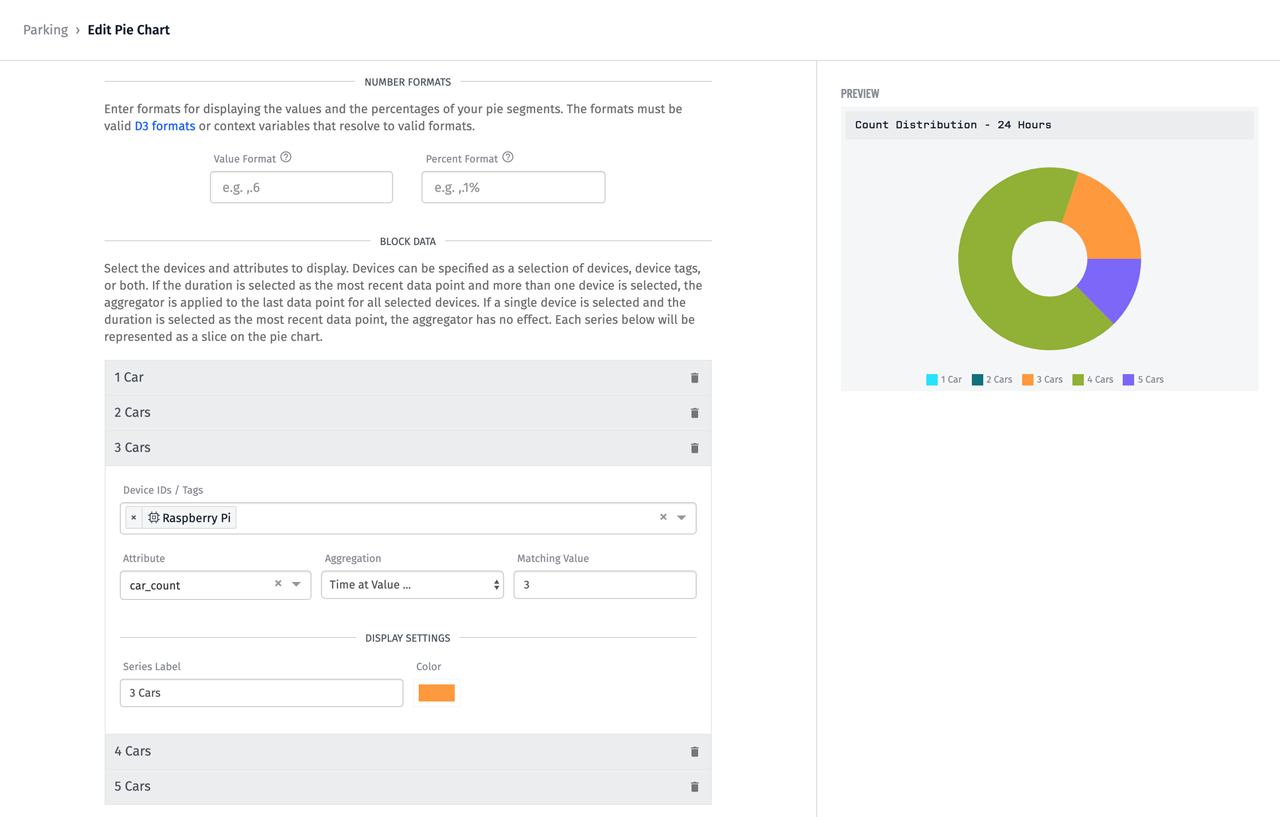
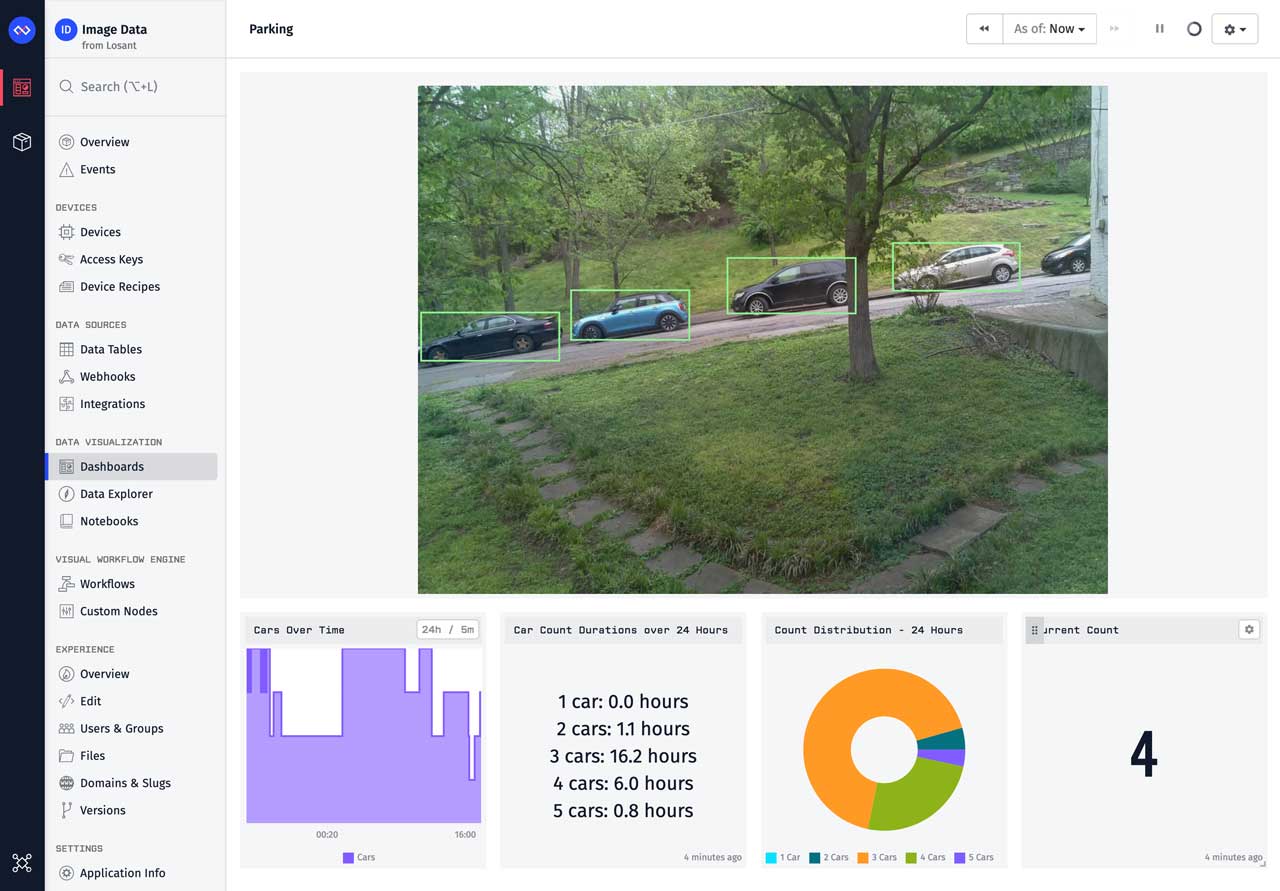
The example in the screenshot above creates a Pie Chart comparing the amount of time a parking area contained a specific number of cars.
MQTT Broker at the Edge
One of the primary use cases for Losant’s Edge Compute functionality is to provide a secure bridge between your local devices and the cloud platform. To facilitate this bridge, the Edge Agent supports a number of connectors that make it easy to communicate with your local devices. These include Modbus, OPC-UA, Serial, UDP, and others.
As MQTT has grown in popularity, so has the number of off-the-shelf devices, like PLCs, that support the protocol. These devices have MQTT clients built-in and we’ve received a number of requests to support these devices at the edge.
As part of this release, the Losant Edge Agent now contains a full MQTT broker. This broker can be used for local machine-to-machine (M2M) communication or to trigger Edge Workflows using the MQTT Trigger to process and forward sensor data to the cloud.
The MQTT broker supports a wide range of configuration options. Refer to the Dockerhub page for details.
Other Updates
- The GPS History and GPS Heatmap blocks can now be populated from device tags.
- Application Templates can now be imported into existing applications.
- A dashboard can now be cloned from one application to a different application.
- Experience Groups can now be created from workflows using the new Group: Create Node.
What’s Next?
With every new release, we listen to your feedback. By combining your suggestions with our roadmap, we can continue to improve the platform while maintaining its ease of use. Let us know what you think in the Losant Forums.