
Images can provide a rich source of IoT data where traditional sensors are either too impractical or too expensive to install. With the increasing availability of off-the-shelf AI/ML and third-party analysis services, utilizing image data for real-world use cases has never been easier.
This tutorial combines the Losant Enterprise IoT Platform and the Google Vision API to build an image-based parking monitoring solution. Losant's platform handles the image ingestion, storage, and data visualization. Google's Vision API handles the vehicle detection.
Reporting Image Data to Losant
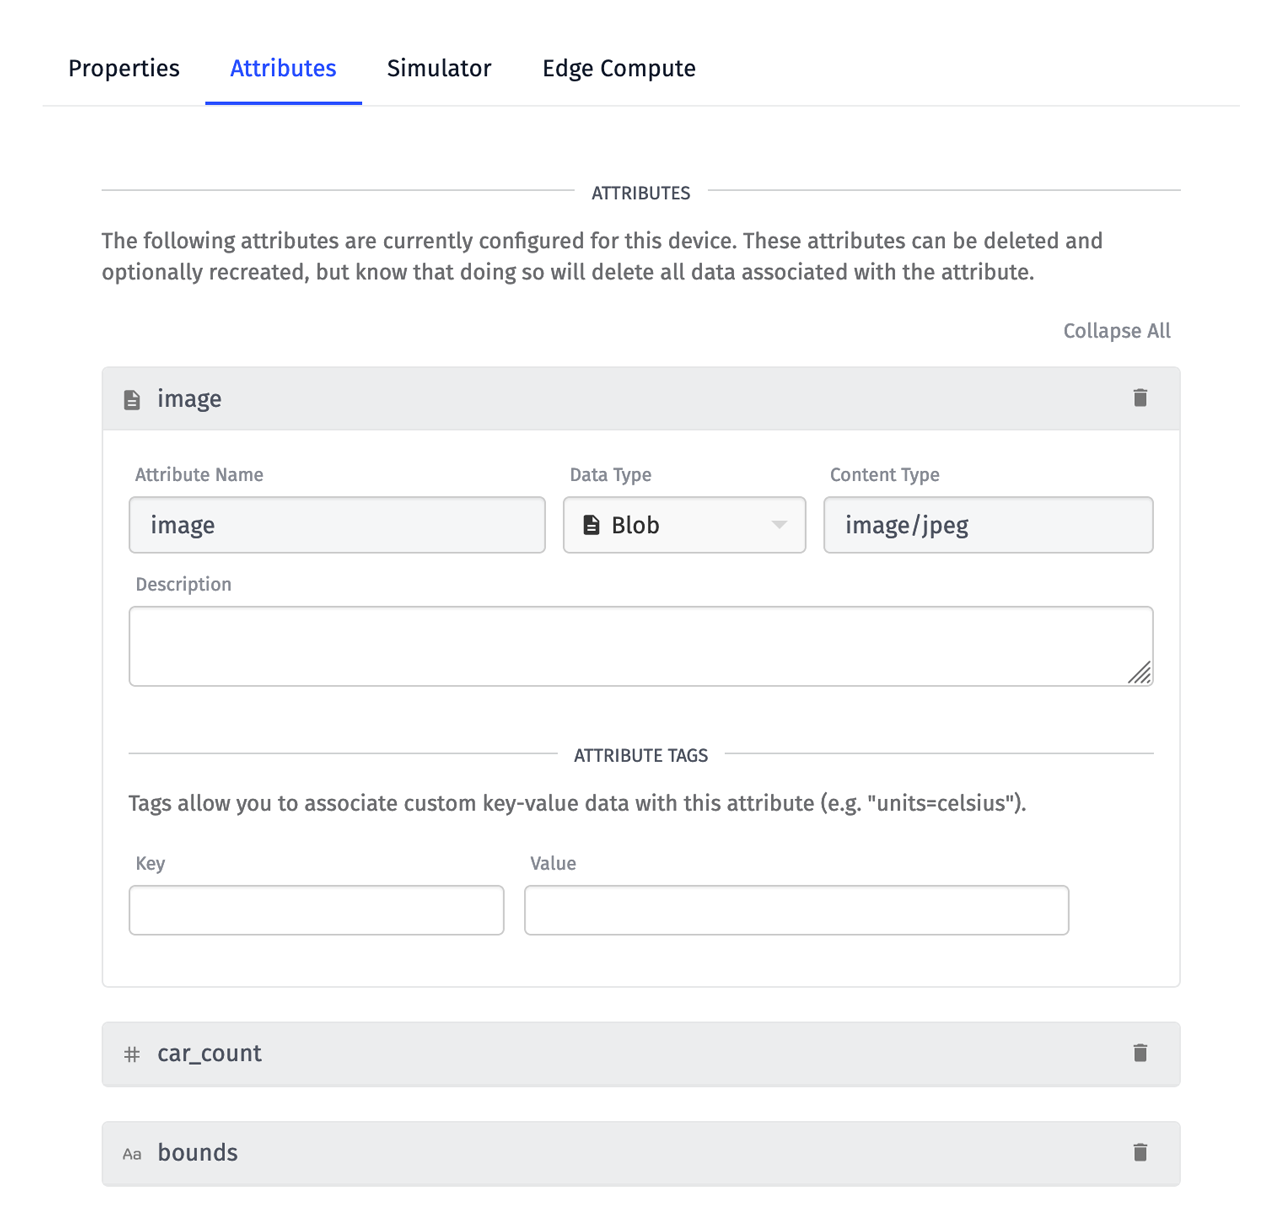
Image data is natively supported by Losant using Blob Attributes.
Reporting blob data to Losant can be done in a number of ways, including MQTT, the REST API, or by using the Edge Agent. All blob data must first be encoded as a Base64 string.
Since image data can come from any number of sources, capturing the image itself is outside the scope of this tutorial. For more information about capturing and reporting image data to Losant, see How to Access the Raspberry Pi Camera from the Losant Edge Agent.
Invoking the Google Vision API From a Losant Workflow
Whenever a device reports its attribute data (i.e. reports state), any Device: State Trigger configured for that device will fire. This trigger places the reported data on the workflow's starting payload. Since we're reporting blob data, we receive the same Base64 string that was sent to the platform.
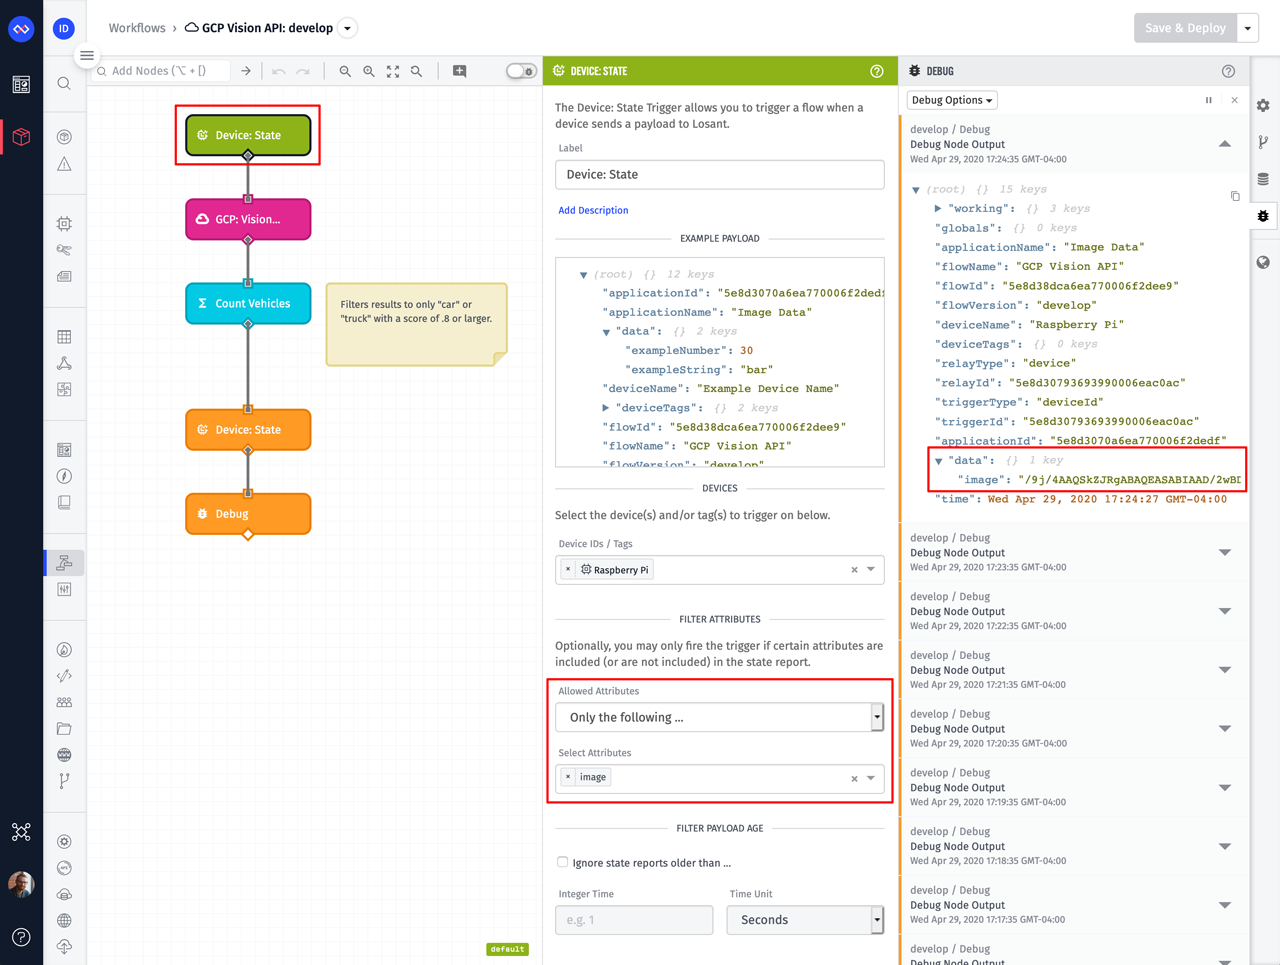
The trigger in the screenshot above is also configured with an attribute filter, so that it only triggers when data is reported for the image attribute.
To make it easy to invoke the Google Vision API, we created the GCP: Vision API custom node, which you can download and import into your own Losant applications.
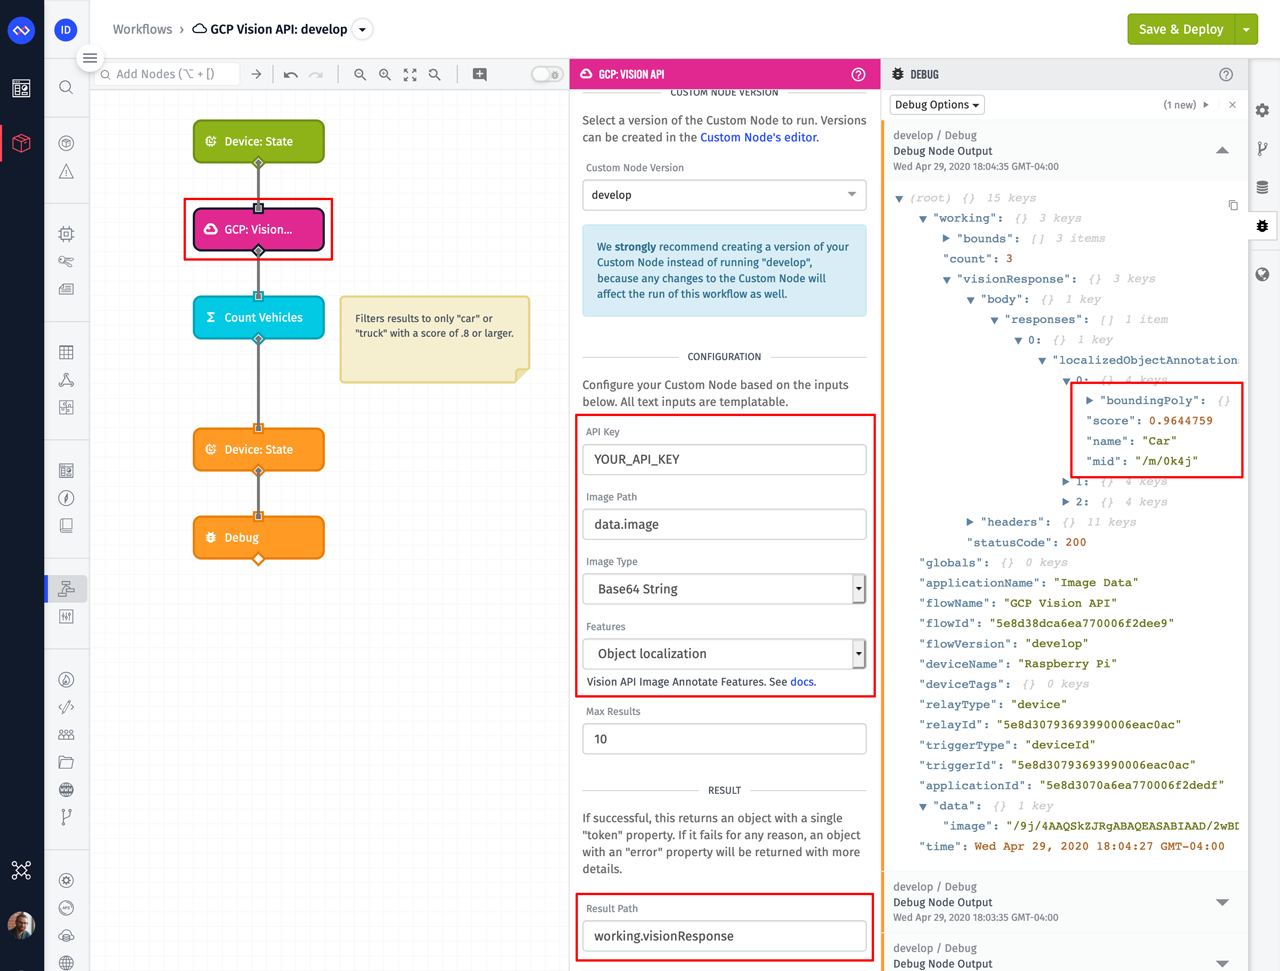
This node requires the following configuration:
- API Key: A Google Cloud API key that has access to the Vision API. For more details on how to obtain this API key, refer to the Google Vision API authentication documentation.
- Image Path: A payload path that points to the image data. In the screenshot above, the workflow trigger has placed the Base64 encoded image on the payload at
data.image. - Image Type: The Google Vision API supports both Base64 encoded data or a URL to an image hosted somewhere else. In this example, we've selected
Base64 String. - Features: The Google Vision API can perform several different operations on the image. The Object Localization option, which is selected in this example, is used to detect objects within an image.
- Result Path: The result of the API request will be placed on the payload at this path.
If we zoom in on the debug log, we can inspect the output from this node:
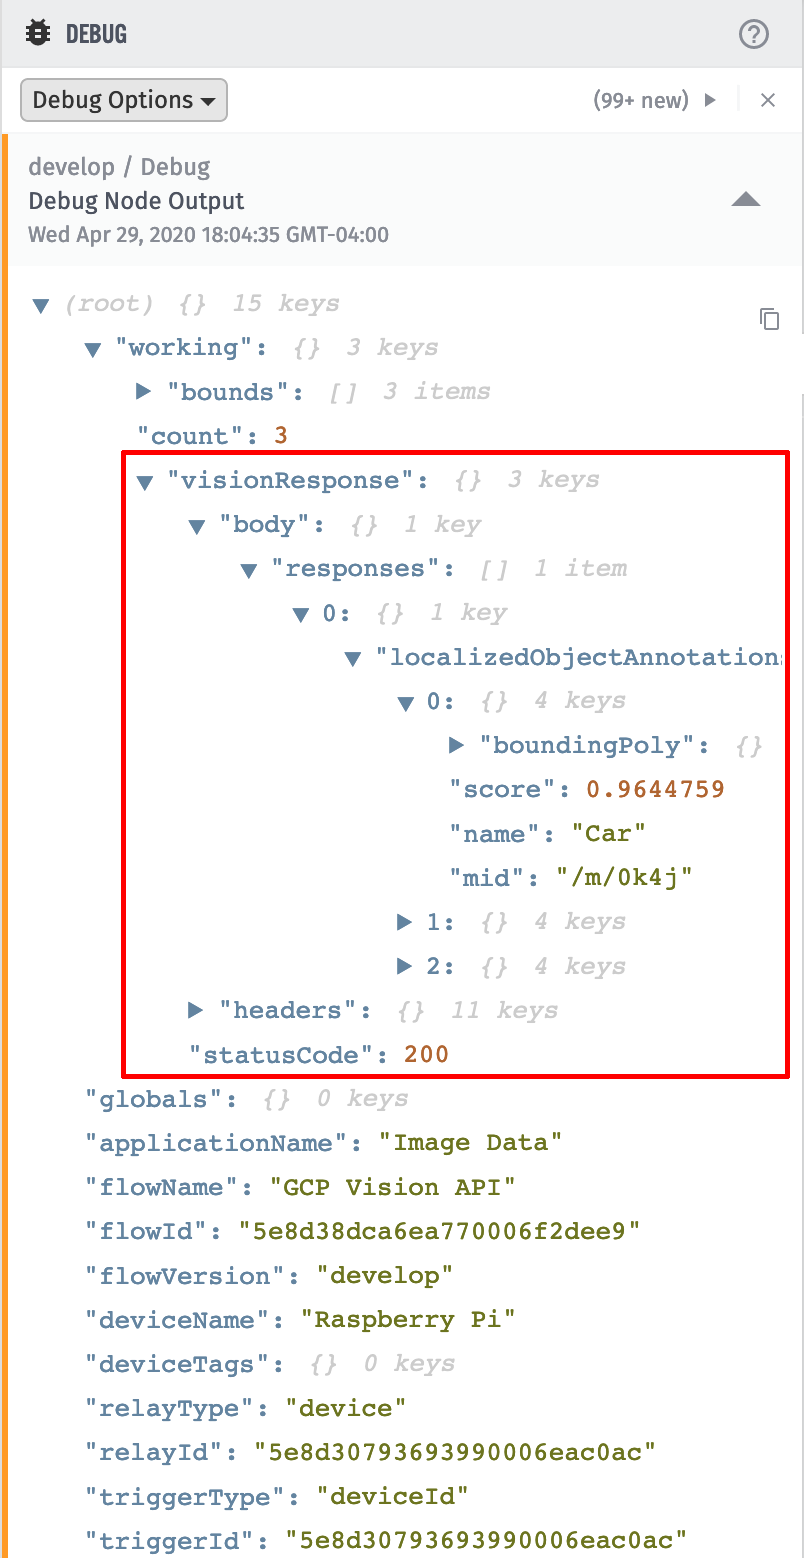
The GCP: Vision API Node is directly passing through the underlying API response. It contains a collection of detected objects, each with a name, a confidence score (between 0 and 1), and a bounding box that describes where that object is within the image.
Storing the Google Vision API Results on a Losant Device
Now that the Google Vision API has identified every object in the image, we need to see how many of those objects were vehicles and report that number on our device's car_count attribute. We also want to report any matching bounding boxes to the device's bounds attribute.
The next node in our workflow is a Function Node, which does the work of filtering the results to only vehicles.
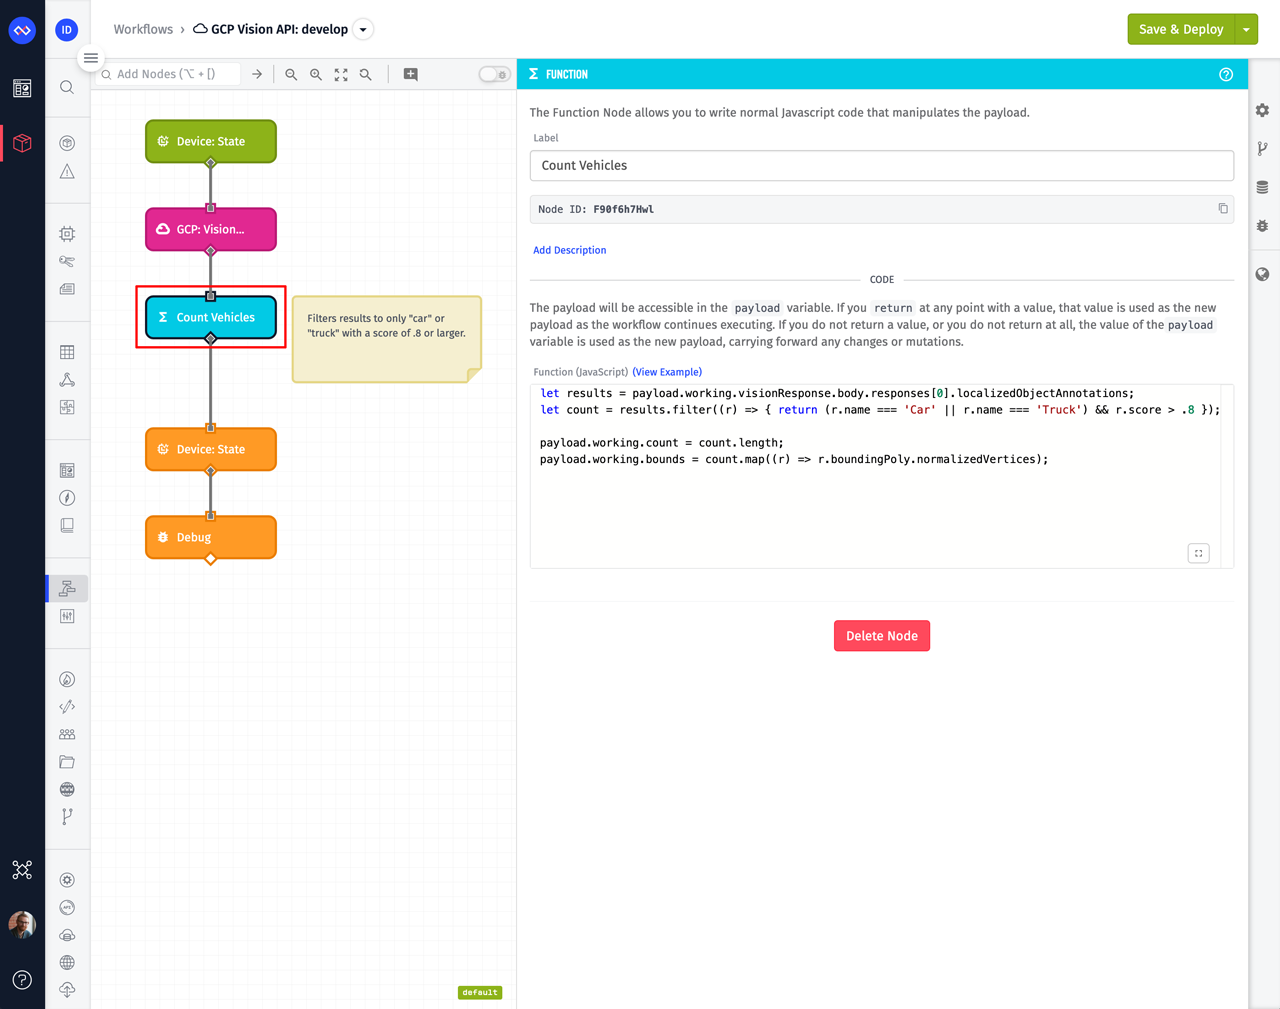
The Function Node supports standard JavaScript. Here are the contents of the node:
let results = payload.working.visionResponse.body.responses[0].localizedObjectAnnotations;
let count = results.filter((r) => { return (r.name === 'Car' || r.name === 'Truck') && r.score > .8 });

payload.working.count = count.length;
payload.working.bounds = count.map((r) => r.boundingPoly.normalizedVertices);
This function is adding two new values to the workflow's payload. The first is the count of any result with a name of "Car" or "Truck" with a score above 0.8. The second is an array of bounding boxes for those same results. These are the values that will be reported on our device.
The next node in our workflow is a Device: State Node. This node is used to record data on a device's attributes.
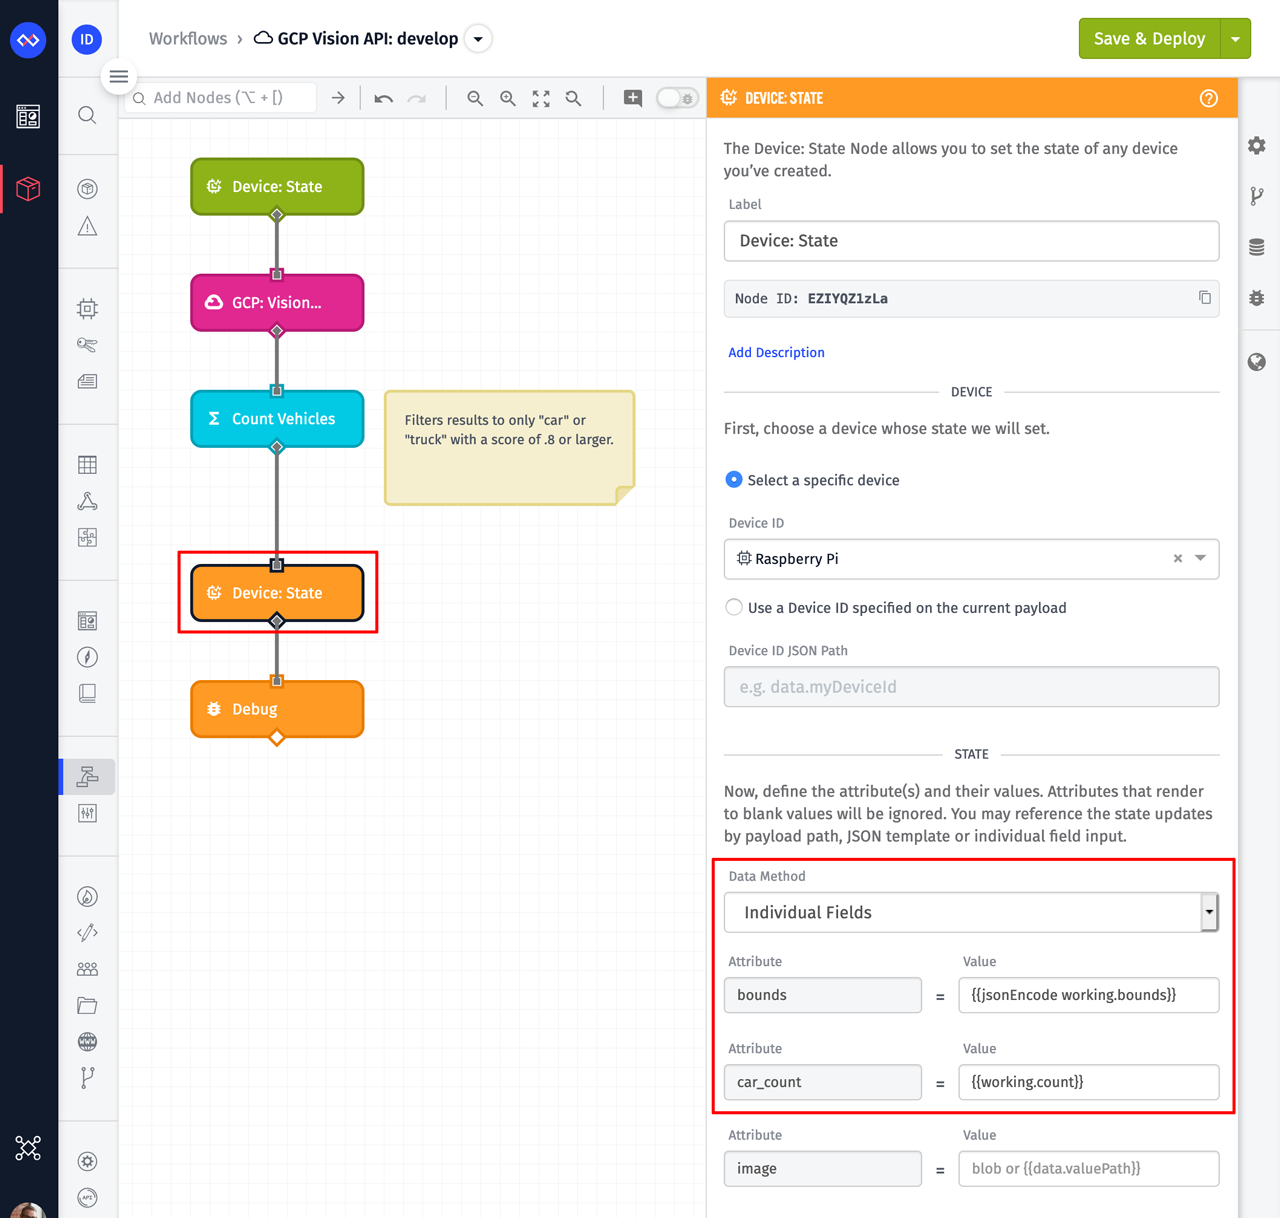
The bounds attribute is a string attribute. This means the array that was created in our function must first be encoded using the jsonEncode helper. The car_count attribute is a number attribute, and since the value is already a number, it can be provided as-is. Nothing is provided for the image attribute because this image has already been reported. That's what originally triggered this workflow.
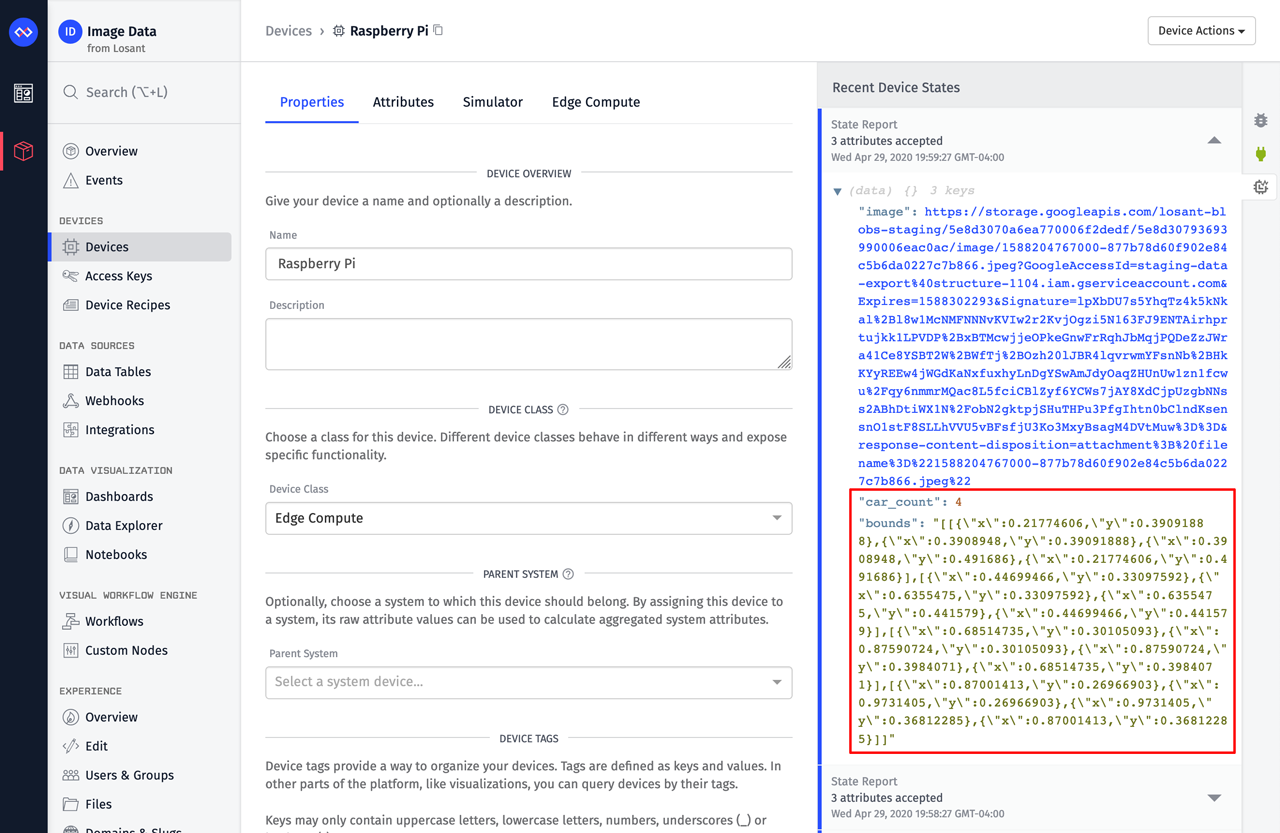
You can inspect the device's recent states log to verify data is properly being recorded:
Displaying the Google Vision API Results on a Losant Dashboard
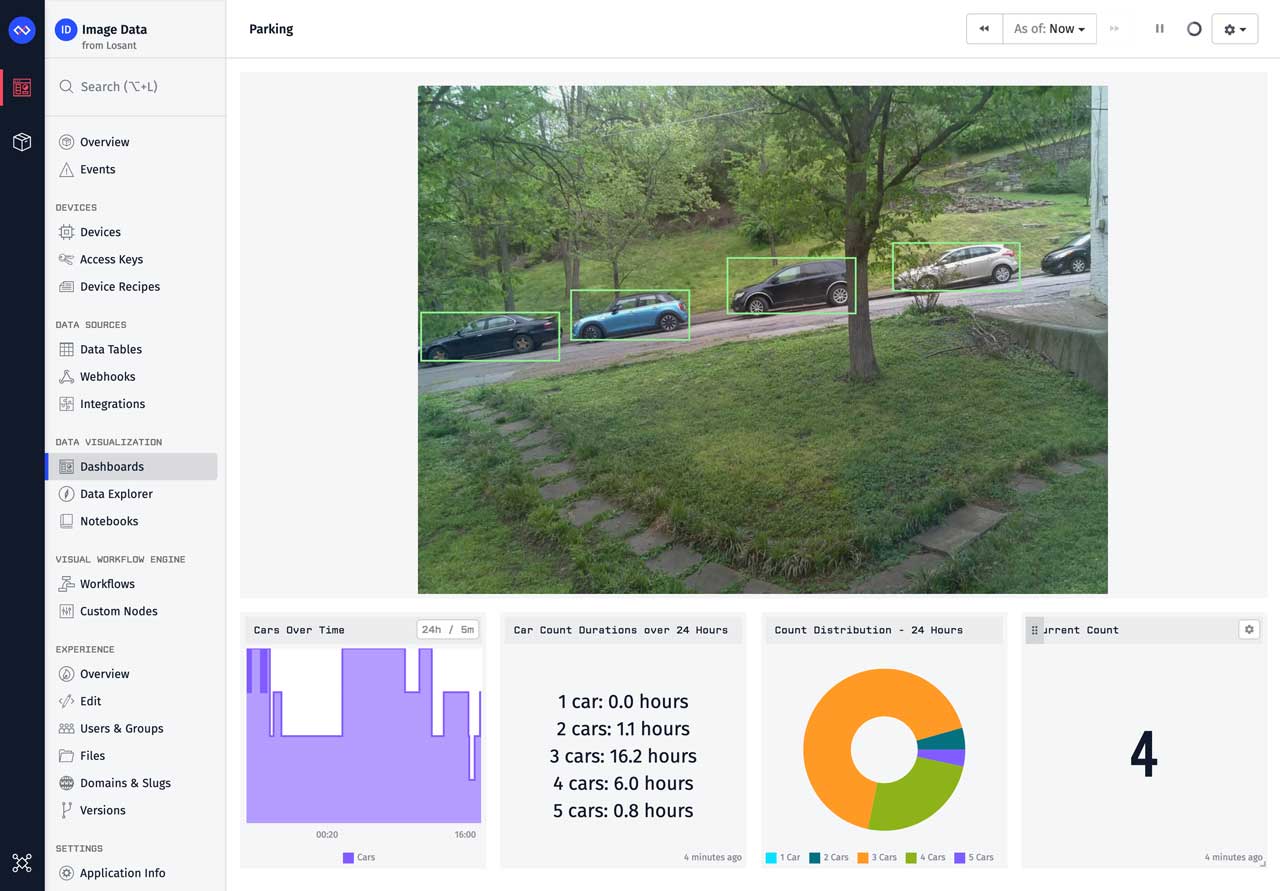
It's now time to build the parking monitor dashboard using the data that's being reported to our Losant device.
Let's start with the Pie Chart.
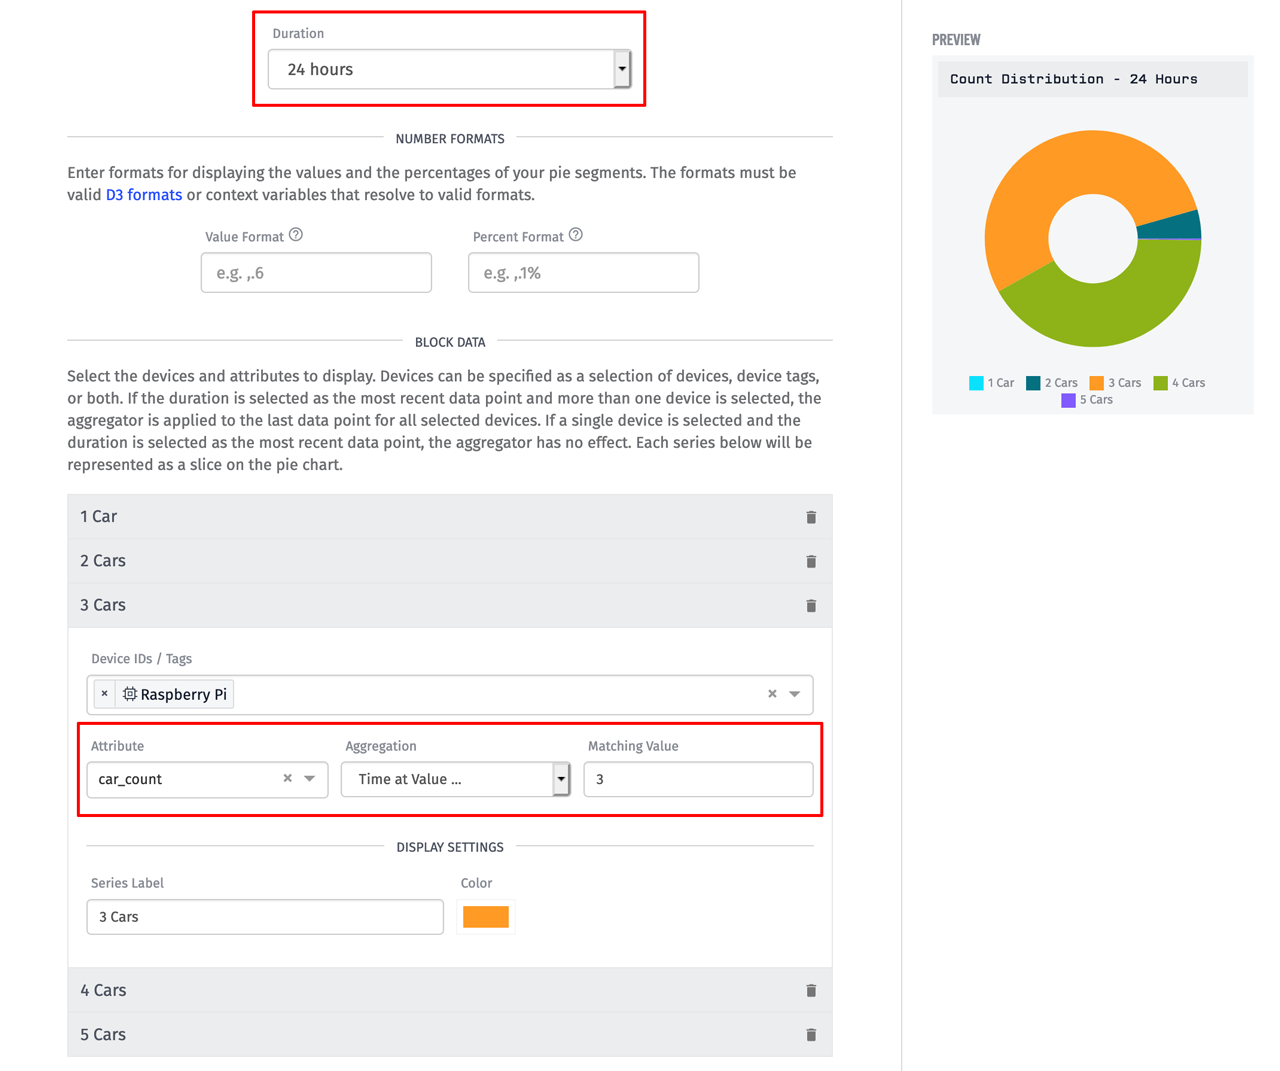
Configuring a pie chart is fairly self-explanatory, however there are two things worth pointing out. The first is that the duration is set to 24 hours. The second is the use of the Time at Value aggregation. In each segment of this chart we want to display the amount of time the car_count attribute was equal to a specific number of cars over the 24-hour duration. The Time at Value aggregation performs this calculation for us.
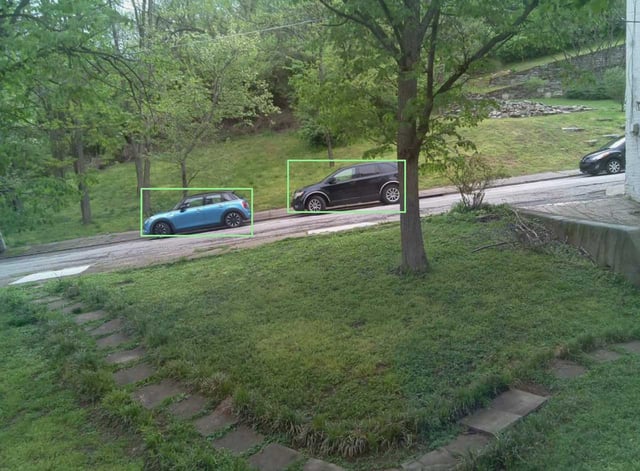
The Image Block directly supports displaying image data that's reported on a device attribute, however, as you can see in our screenshots, we're also displaying bounding boxes to highlight each vehicle:
To add these custom visuals, we'll use the Custom HTML Block. This block allows us to query data from a variety of places within Losant, including devices, and then present it using any custom HTML, CSS, or JavaScript. To configure this block, we first need to query the image and bounds attributes from our device:
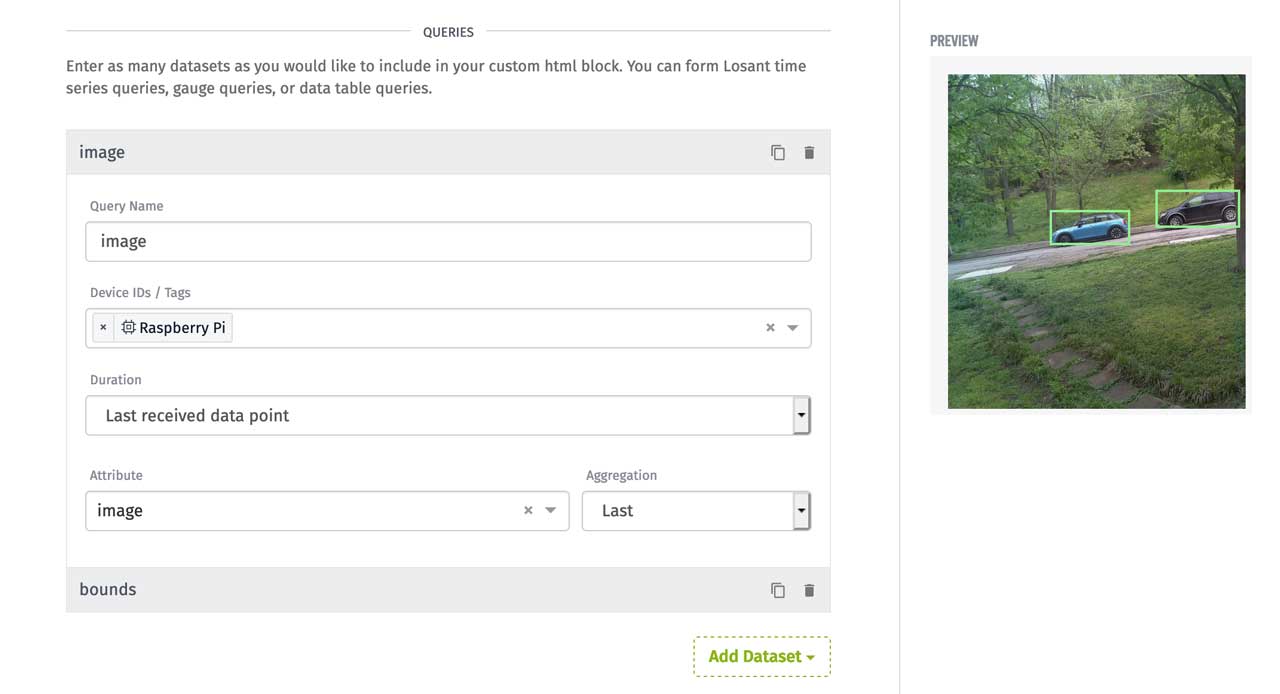
To present this data, the block requires both body and head content. The body typically contains HTML markup. The head typically contains your JavaScript and CSS. The entire contents of this block's body and head is below:
Stepping through this code line-by-line is outside the scope of this tutorial, but feel free to explore and modify the code as needed to get your desired results.
The other blocks on this dashboard are a Time Series Graph, an Indicator Block, and a Gauge Block. Configuring these blocks is a great learning exercise for you. If you are new to Losant, check out the Losant Walkthrough, which provides step-by-step instructions.
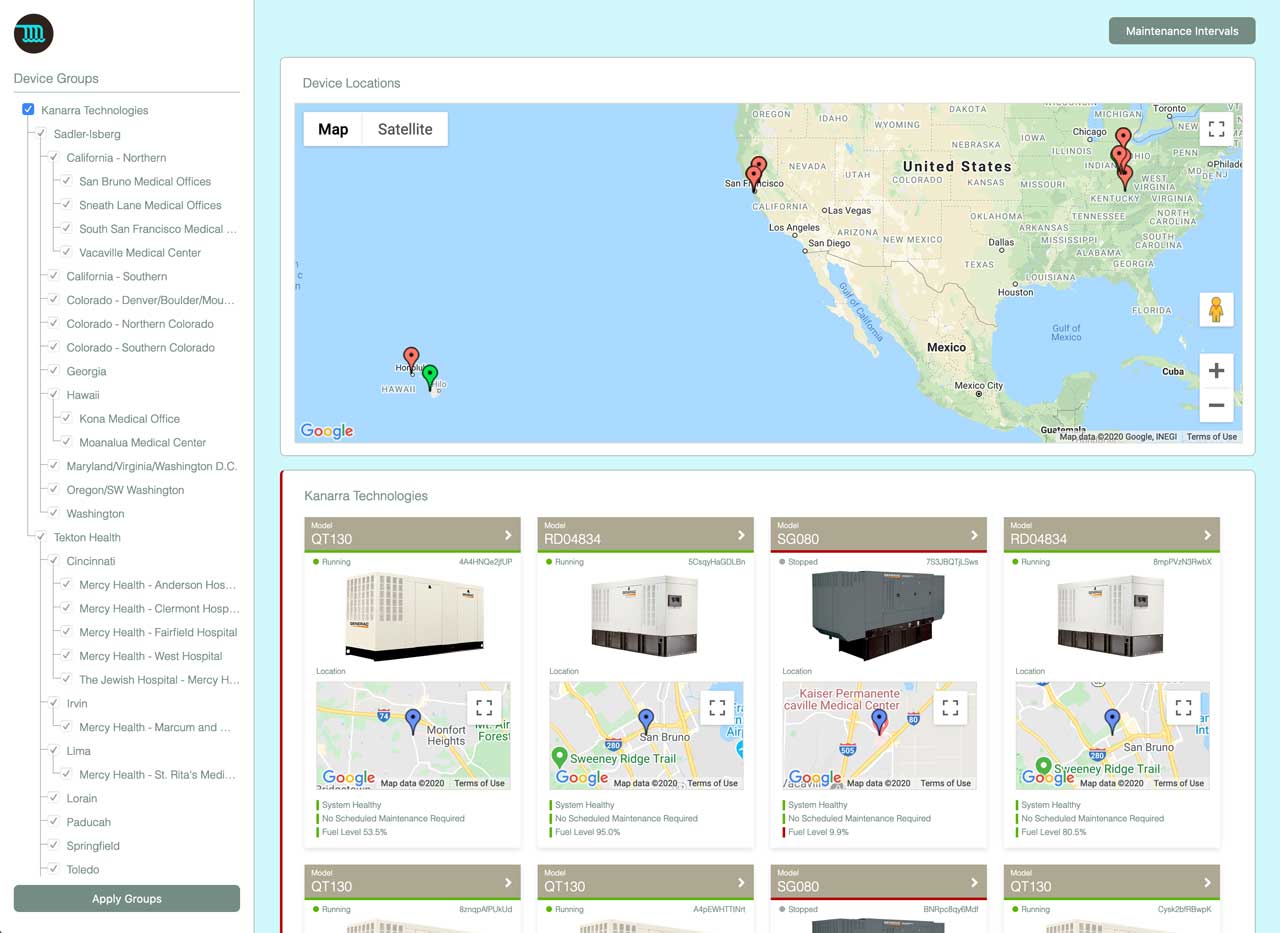
Build a Complete Multi-Tenant IoT Application with Losant Experiences
Ingesting image data, analyzing it, and presenting it on a dashboard is a great step towards a complete application. With Losant Experiences, you can expand this application into a fully-branded multi-tenant IoT service that can be delivered to any number of customers or end users.
Parking monitoring is only a single example of the wide variety of IoT applications that can be developed and distributed using the Losant Enterprise IoT Platform.
If you have any questions about the content in this tutorial, or if you used Losant and the Google Vision API to build something cool, let us know in the Losant Forums!