Our team has been hard at work creating the best developer platform for quickly and easily building complex connected solutions. We'll be opening it up for general availability soon, but we wanted to provide a sneak peek into what the platform looks like and some of the features it provides.
If you're interested in keeping up to date on Losant news and be notified when it's available for use, please sign up for our newsletter.
In order to properly show Losant I needed a good use-case, so I chose to start quantifying myself. IoT devices are typically thought of as things like Raspberry PIs and Arduinos, but in reality anything with a network connection is potentially an IoT device. In this case, the device I'm using is my Android phone.
The high-level overview of the application I'm building is a personal location tracker. My phone will send my GPS coordinates every 5 minutes to the Losant platform. Losant then provides a suite of visualizations for me to view my location over time. I then use Losant's workflow engine to configure geofences around my common destinations (e.g. "home" and "work") to view the distribution of time spent at various places.
Create Losant Application
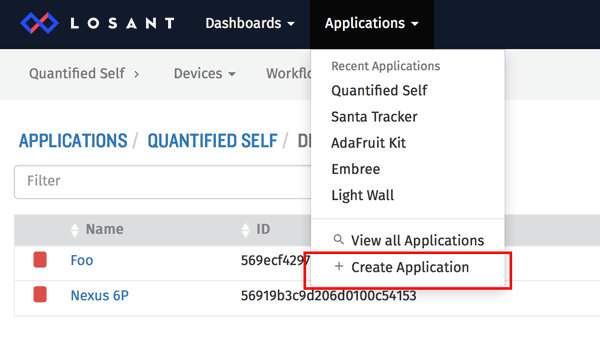
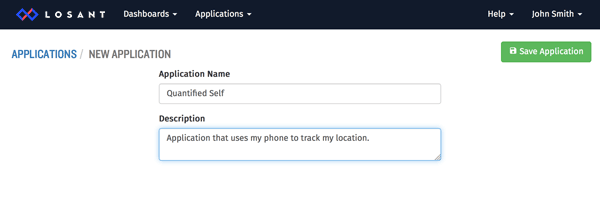
The first thing to do is create an application that will hold my device. From the main menu, select "Create Application" and fill out a name and optional description.
Add the Device
Now that we've got an application, we need to register our device. Device registration has two important goals. The first is to get a unique ID that Losant requires for proper identification and authorization of the device. The second is to describe the state attributes for the device data. Losant provides many built-in visualizations of known datatypes, which include numbers, booleans, strings, and GPS locations.
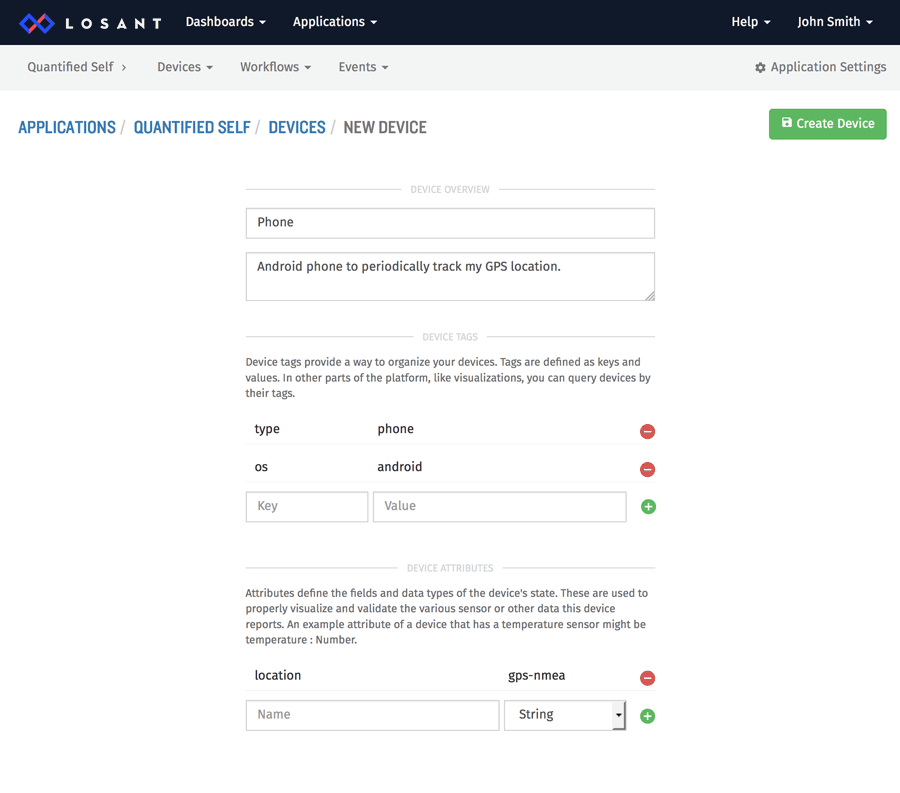
For this example I named my device "Phone". The next section, which are "tags", are used to query, filter, and organize your devices. This won't be important now, but if you have thousands of devices, tags become a valuable way to organize them.
The last section is the most important, which describes the attributes of my device's state. When we typically think of IoT devices, state attributes usually map to sensors, for example "temperature", "acceleration" or "sound level". A device state is simply a snapshot of the device at some point in time. Devices report their state to Losant as often as needed. My phone, for example, will report its "location" state every 5 minutes.
The Android App
Now that the device is registered and I have an ID, I can write the app to send GPS coordinates. I implemented my app as a simple Android service that grabs the GPS location every 5 minutes and sends the data to Losant.
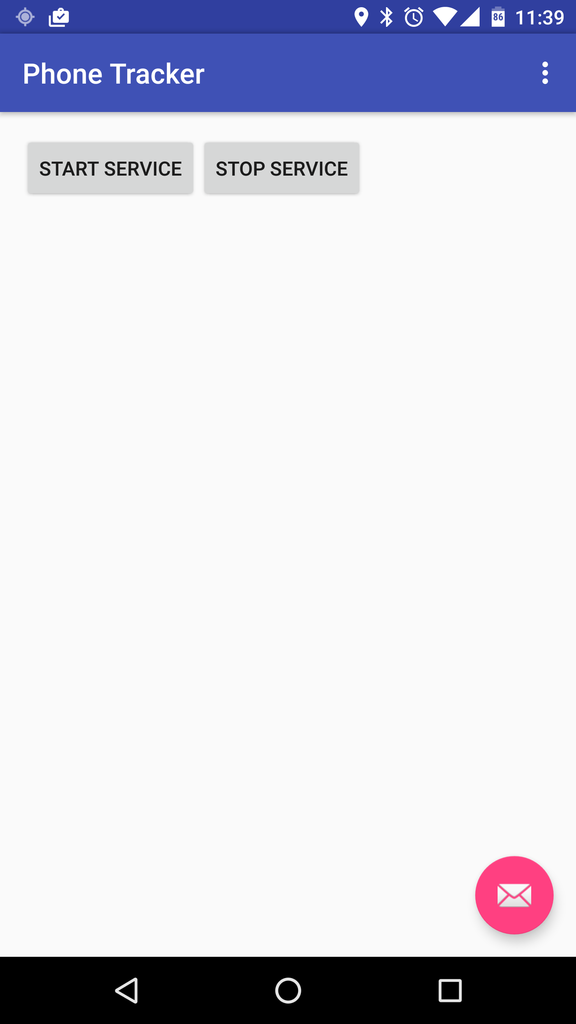
The application is open-source and available on GitHub, so I'm not going to cover the guts in this article.
The Losant API uses JSON and supports both REST and MQTT protocols. For this app I chose to use REST because there was no point in maintaining the persistent connection required by MQTT. I simply POST our state information to the Losant API every 5 minutes. The payload looks like this:
{
  "data": {
    "location": "$GPGLL,3906.71226,N,8430.74572,W,230407,A,*26"
  }
}
All of your device attributes are specified on the "data" property of the state payload. In this example we set the "location" property to the NMEA string representing the current location.
They have not yet been open-sourced, but Losant does provide SDKs for common environments, which abstracts the underlying API and makes communicating with the platform much simpler.
That's pretty much it for the actual device code. One of the primary goals of Losant is to keep devices as simple as possible and move the complexity up to the cloud. Now that we've got location going to the Losant platform every 5 minutes, there's all kinds of cool things we can do with it.
Data Visualization
Now that we've got data, let's visualize where I've been. Losant supports a fully customizable dashboard with many built-in visualizations. Let's start with a GPS heatmap that shows a distribution of where I spend my time.
As you can see, over the last 24 hours I've spent my time in basically three locations. One is home, one is work, and one is where I ate lunch. Configuring the heatmap is simple, but also provides powerful aggregation features when viewing multiple devices.
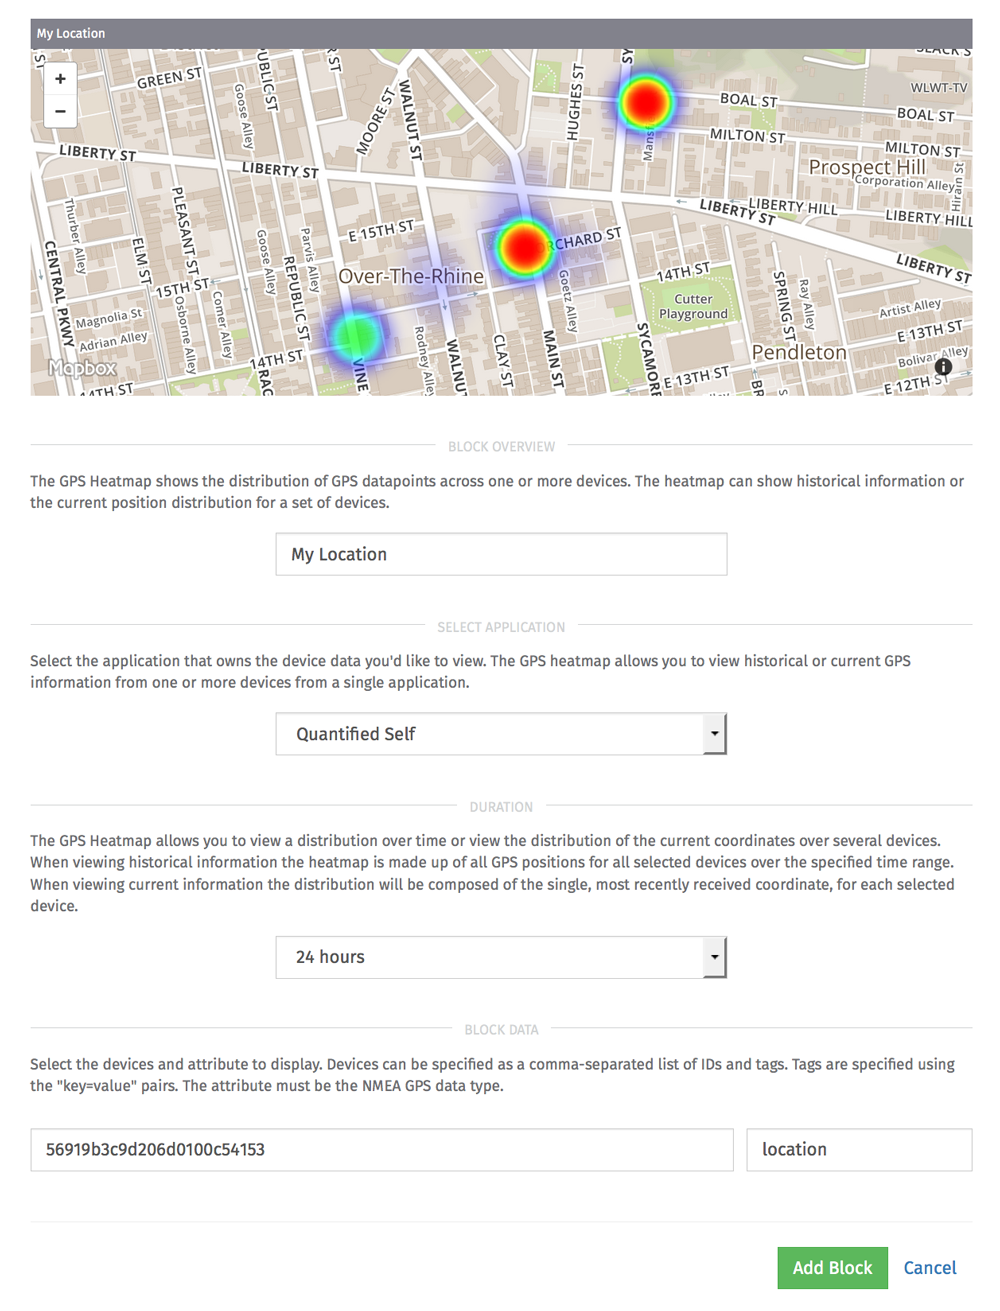
For this configuration I chose to view the last 24 hours and used the "location" attribute of my single device. The heatmap also supports a real-time snapshot of the most recent data over an entire fleet of devices, so if you had thousands of devices all over the world and you wanted to see a distribution of their location, that can be easily accomplished. This is also where those device tags would come into play. Instead of specifying a single device ID I could specifiy a device tag (e.g. "os=android") and see a distribution of all devices where the "os" tag equals "android".
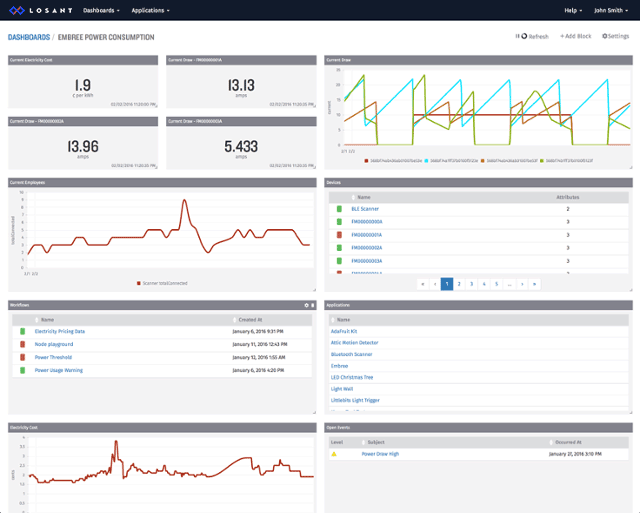
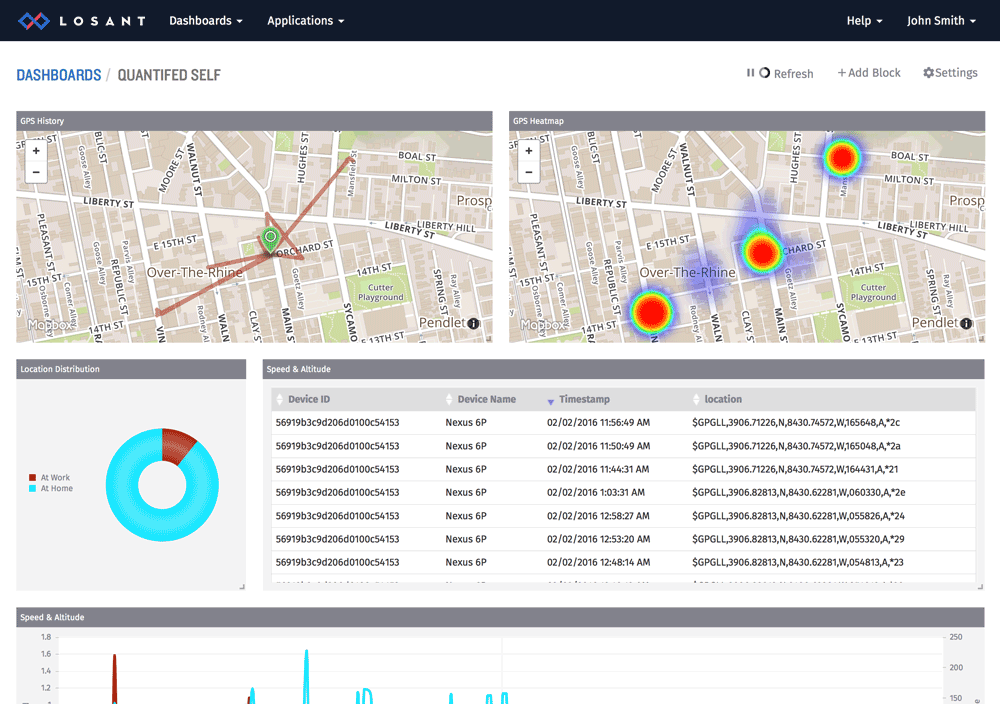
Losant's dashboarding supports simple drag and drop resizing and rearranging. Once the block is added, moving it where you want is extremely simple. Below is an example of my heatmap plus several other useful blocks.
Geofences
The 2nd part of my solution is to break down where I spend my time, which either at home, at work, or other. We're going to use Losant's workflows to accomplish this. A workflow is a simple drag & drop series of tasks triggered whenever a device's state changes. In this example, it will be triggered whenever my phone reports its location.
As the above video shows, each time my phone reports location it checks up to two geofences. The first is for at home, the second is for at work, and if it's neither of those it's just falls in the other bucket.
I'm using another feature of the Losant platform called a "virtual device" to store this information. When you register a device you can optionally make the device virtual if it doesn't correspond to an actual physical object. So in this case whenever the geofence determines I'm at home, I report the state of { atHome: 1 } to the virtual device. I can now visualize, and even trigger other workflows, from this higher level location data.
Now that I have a virtual device holding my higher level location data, I can create a new visualization to show a breakdown of my time spent at various locations.
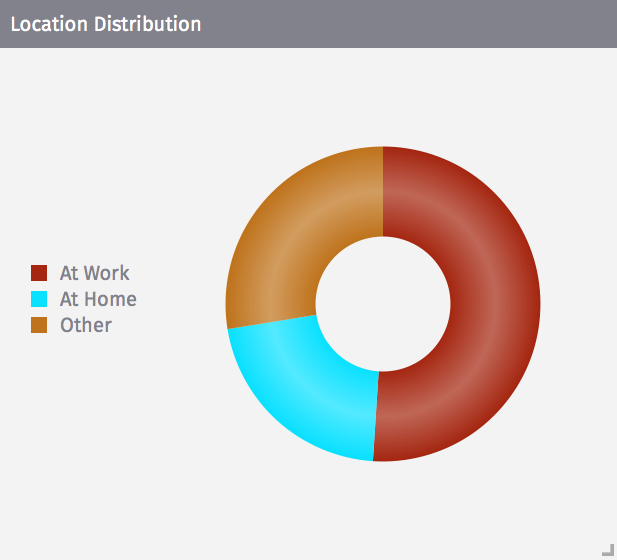
The pie chart is configured similarly to the heatmap, except each individual segment can be configured with one or more devices or aggregated values.
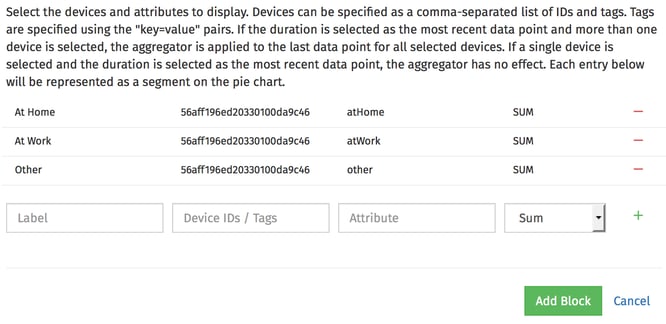
As you can see I configured three segments with the various attributes of my new virtual device. I aggregate the values by summing them together over the last 24 hours to create my final pie chart.
Even with this relatively simple application, it's amazing what trends and insights I can start seeing with my own location data. This post barely touches the surface of what Losant provides, but hopefully it offered a good overview of some of the features you can expect when it launches.

