
The Johnny-Five Inventor's Kit provides a bunch of hardware and sensors that can be used to build a wide variety of small projects. They also have an experiment guide that includes detailed instructions for nearly every component. In this tutorial, we're going to combine a few of the sensors and build an indoor environmental monitoring station with a full dashboard.
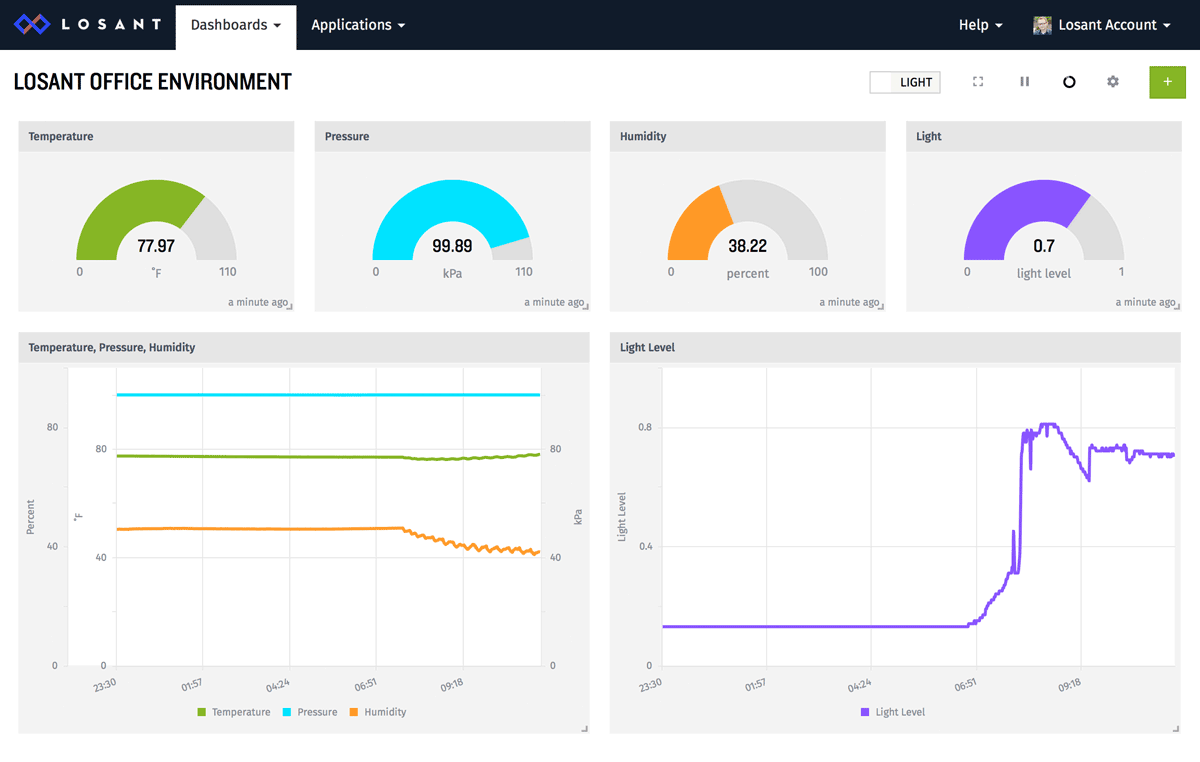
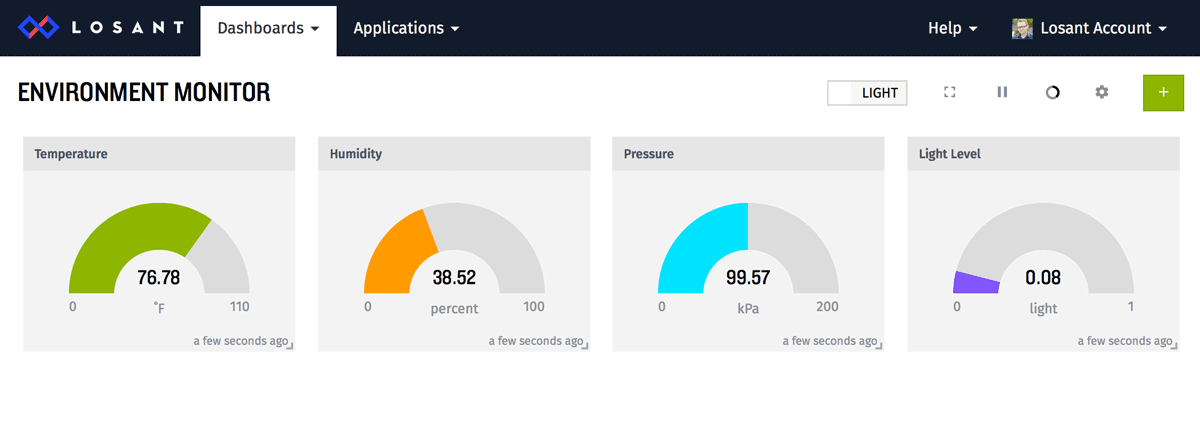
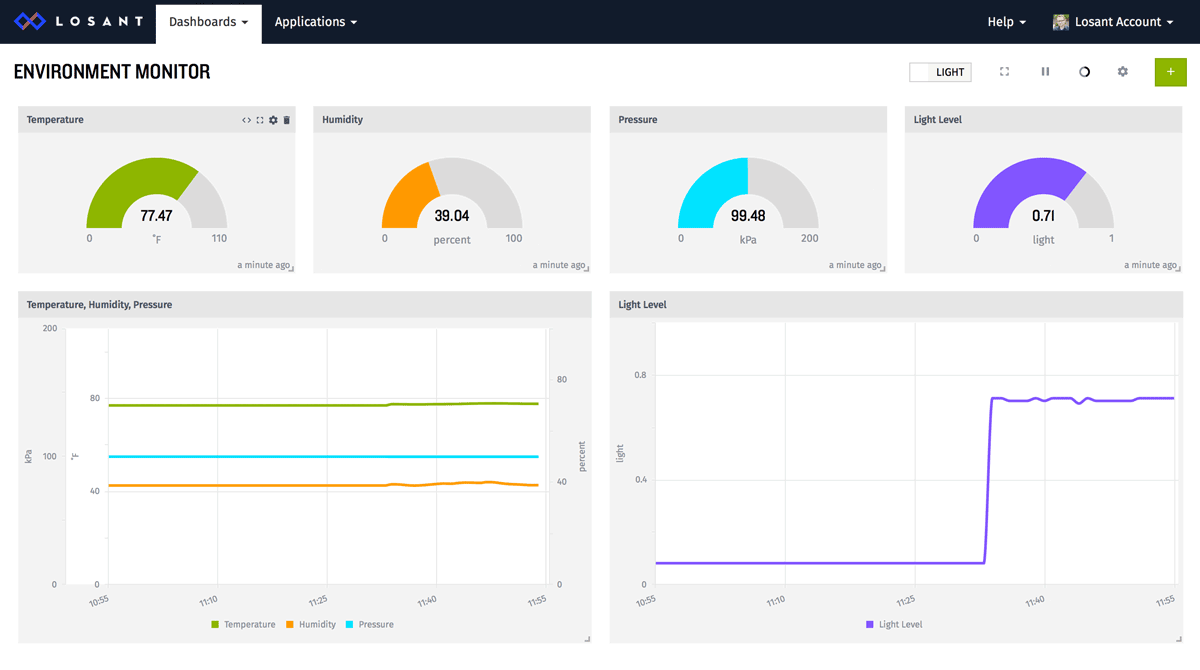
Here's the dashboard we're going to build. It displays the real-time and historical values for temperature, humidity, pressure, and light level.
Tessel 2 Setup
The heart of the Johnny-Five Inventor's Kit is a Tessel 2 compute module. Follow the kit's guide to properly setup the Tessel 2. It's probably a good idea to do a few of the experiments in the guide as well, just to get more comfortable with the development flow.
Wiring
The next step is to wire up the sensors. Follow the kit's instructions to properly connect the BME280 and the Light Sensor to the Tessel. Once both are connected, it should look something like this:
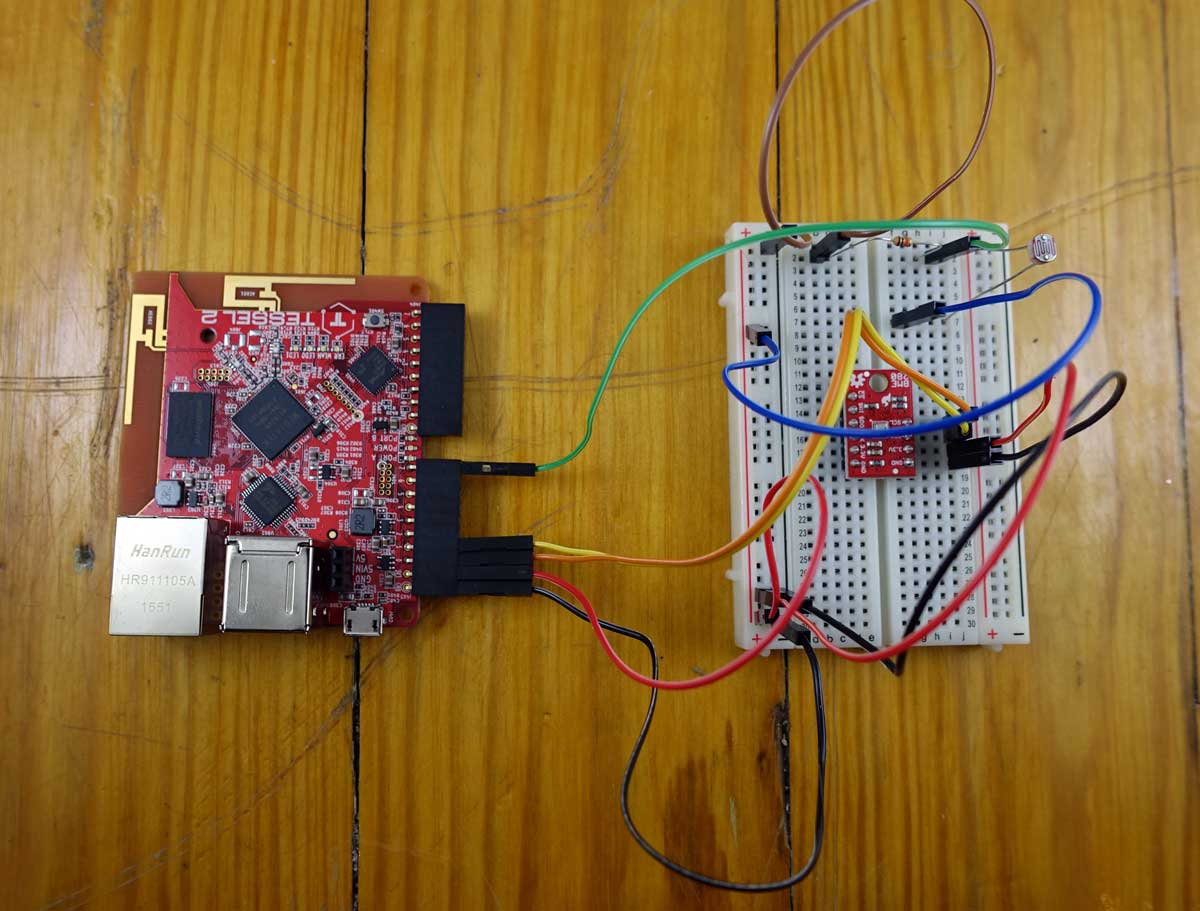
The BME280 has temperature, humidity, and pressure sensors. We then add the light sensor for additional monitoring.
Losant Setup
Now that we have everything wired up, we need to create a device in Losant that will collect all of this sensor data. If you haven't already, sign up for a Losant account.
Once signed up, create a new application using the Applications -> Create Application menu. You can name it anything you want.
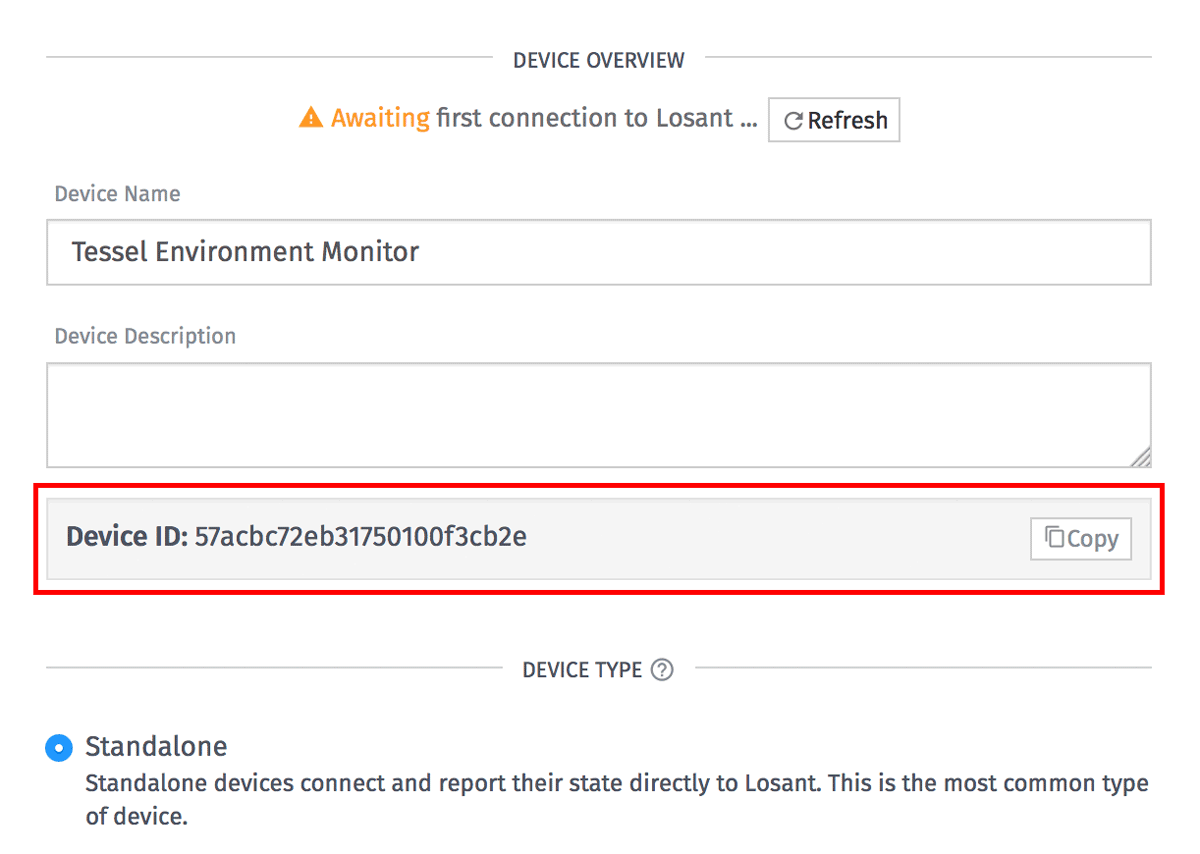
Next, add a new device to the application using the Devices -> Add Device menu. You can name the device anything you'd like. Make sure "Standalone" is selected as the device type. Lastly, add device attributes for each of our sensors.
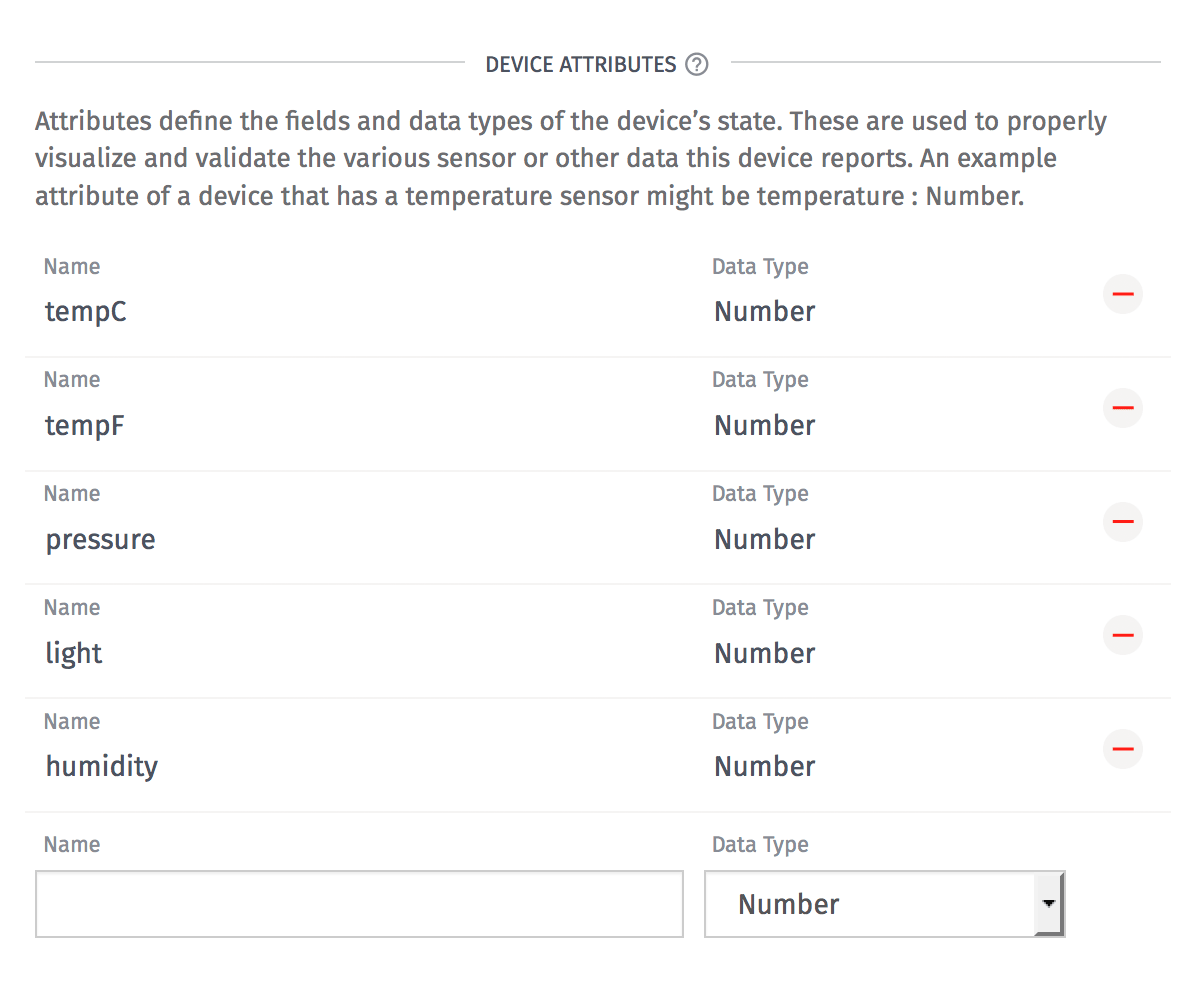
Add the following attributes and set their data type to "Number":
tempC, tempF, pressure, light, humidity
The source code we'll be flashing in the next section will read the attached sensors and report their values using the above attribute names. Attribute names are case-sensitive.
After you click "Save Device" the screen will change and display your device ID. Copy/paste this somewhere convenient since you'll need it soon.
Next, create an access key that we can use to authenticate this device. Create a new access key by selecting "Security" from the application menu bar and then choosing "Device Access Keys" in the left navigation. Once there, you can then click the "Add Access Key" button on the top-right.
Leave the "All Devices" option selected and click "Create Access Key". This will display a popup with your key and secret. Copy/paste these somewhere convenient. Losant doesn't store the secret, so it's very important you copy it somewhere secure.
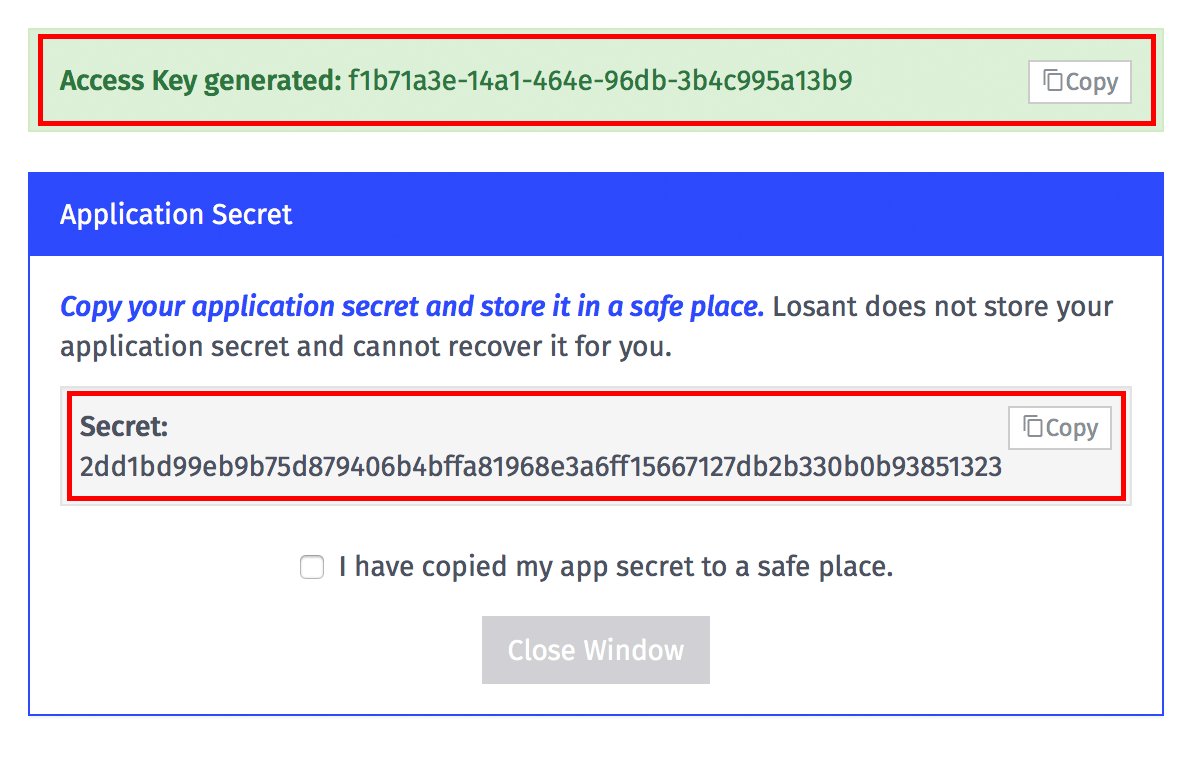
We now have everything required to connect our Tessel to Losant and begin streaming data.
Tessel Firmware
The next thing we need to do is upload some firmware to the Tessel to read the sensor values and report them to Losant. If you're new to Tessel, I would highly recommend going through the hardware setup and blink an LED articles in the guide. These will cover how to connect the Tessel to WiFi and provide a good introduction to the Johnny-Five module.
The source code for the environment monitor is available at the following GitHub repo:
https://github.com/Losant/example-tessel-environment-monitor
After cloning or downloading the repository to your local computer, edit the index.js file to set the device ID and access key to the values you obtained earlier:
var device = new Device({ id: 'my-device-id', key: 'my-access-key', secret: 'my-access-secret'});
Near the top of the index.js file you'll see this section. Replace "my-device-id" with the ID you obtained after adding the device to your application. Replace "my-access-key" and "my-access-secret" with the key and secret values you created in the previous step.
Once those are replaced you're ready to run npm install and deploy the code to your Tessel.
npm installt2 run index.js
It will take a few seconds to run, but you should eventually see the console print "Connected to Losant!". Once you see that, you can open your application dashboard and view the communication log to see sensor data streaming in.
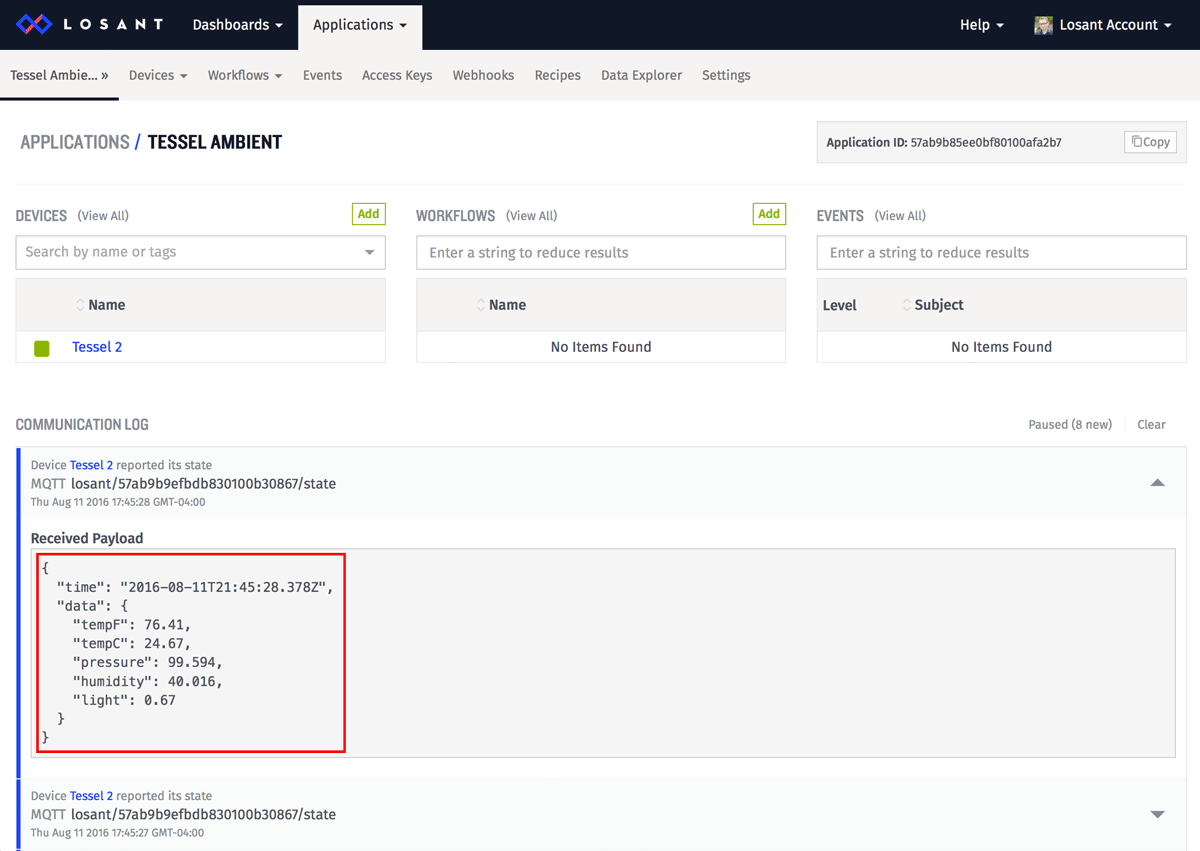
The firmware we just flashed reports sensor data once per second, so you'll see an entry in the communication log every second. If you see any errors, double-check your device id, access keys, and ensure the device attributes are spelled correctly.
Build the Dashboard
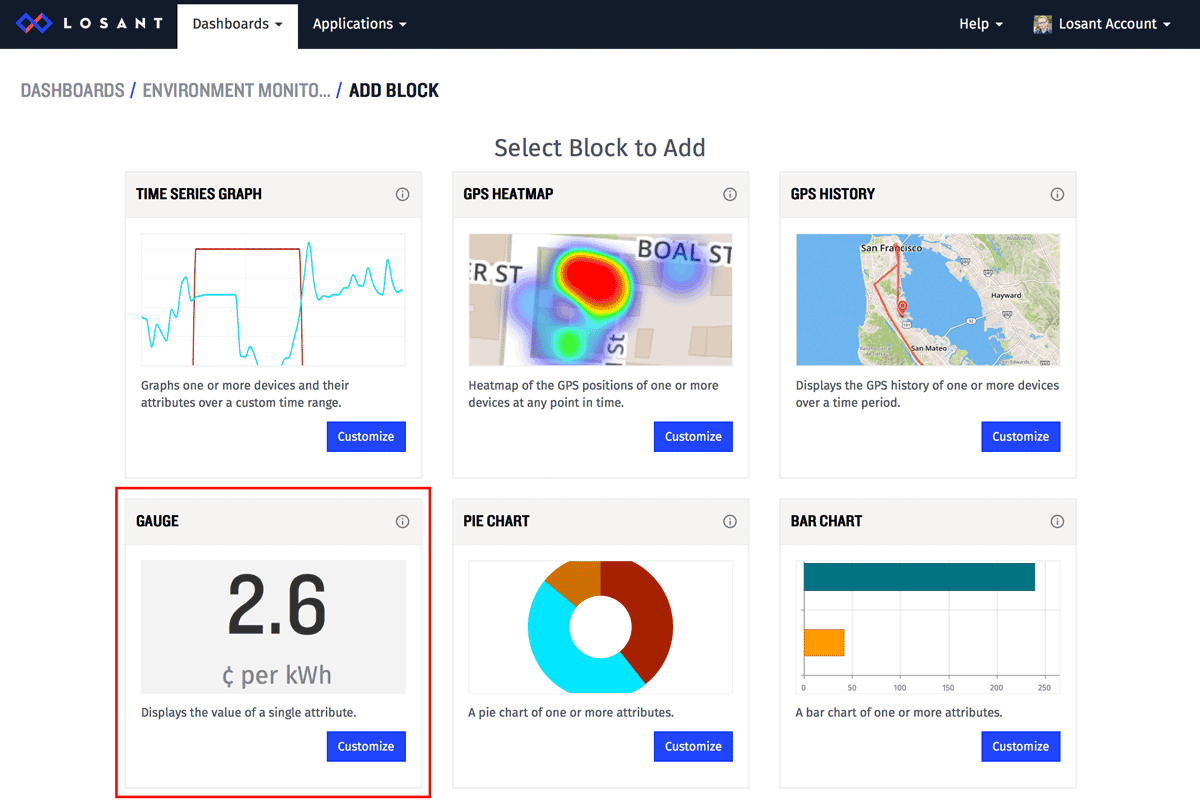
Now that data is streaming into the platform, we can create a dashboard to display it. Create a new dashboard by using the Dashboards -> Create Dashboard menu. Name it anything you'd like.
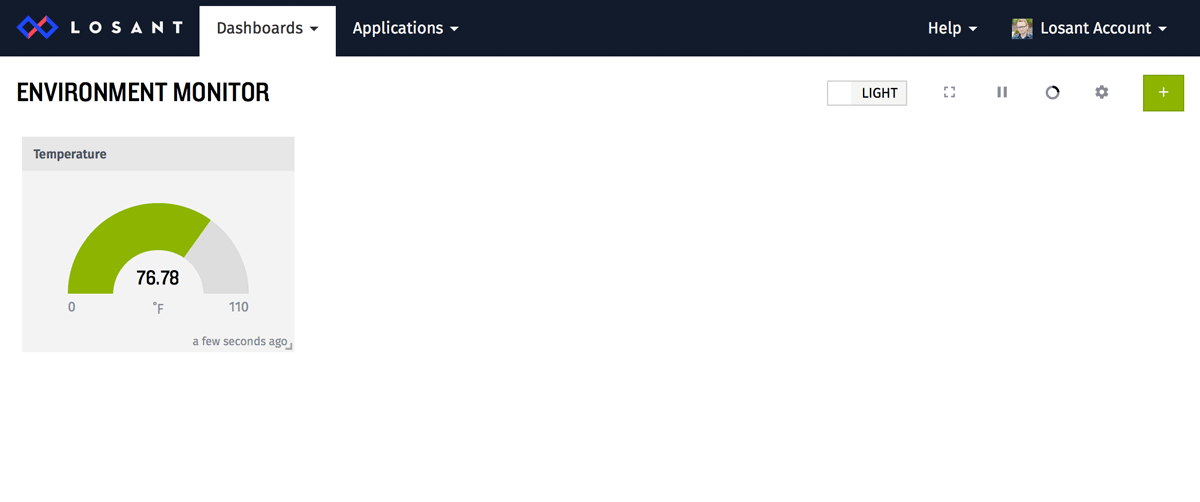
First, add a gauge block to view the real-time value of the temperature.
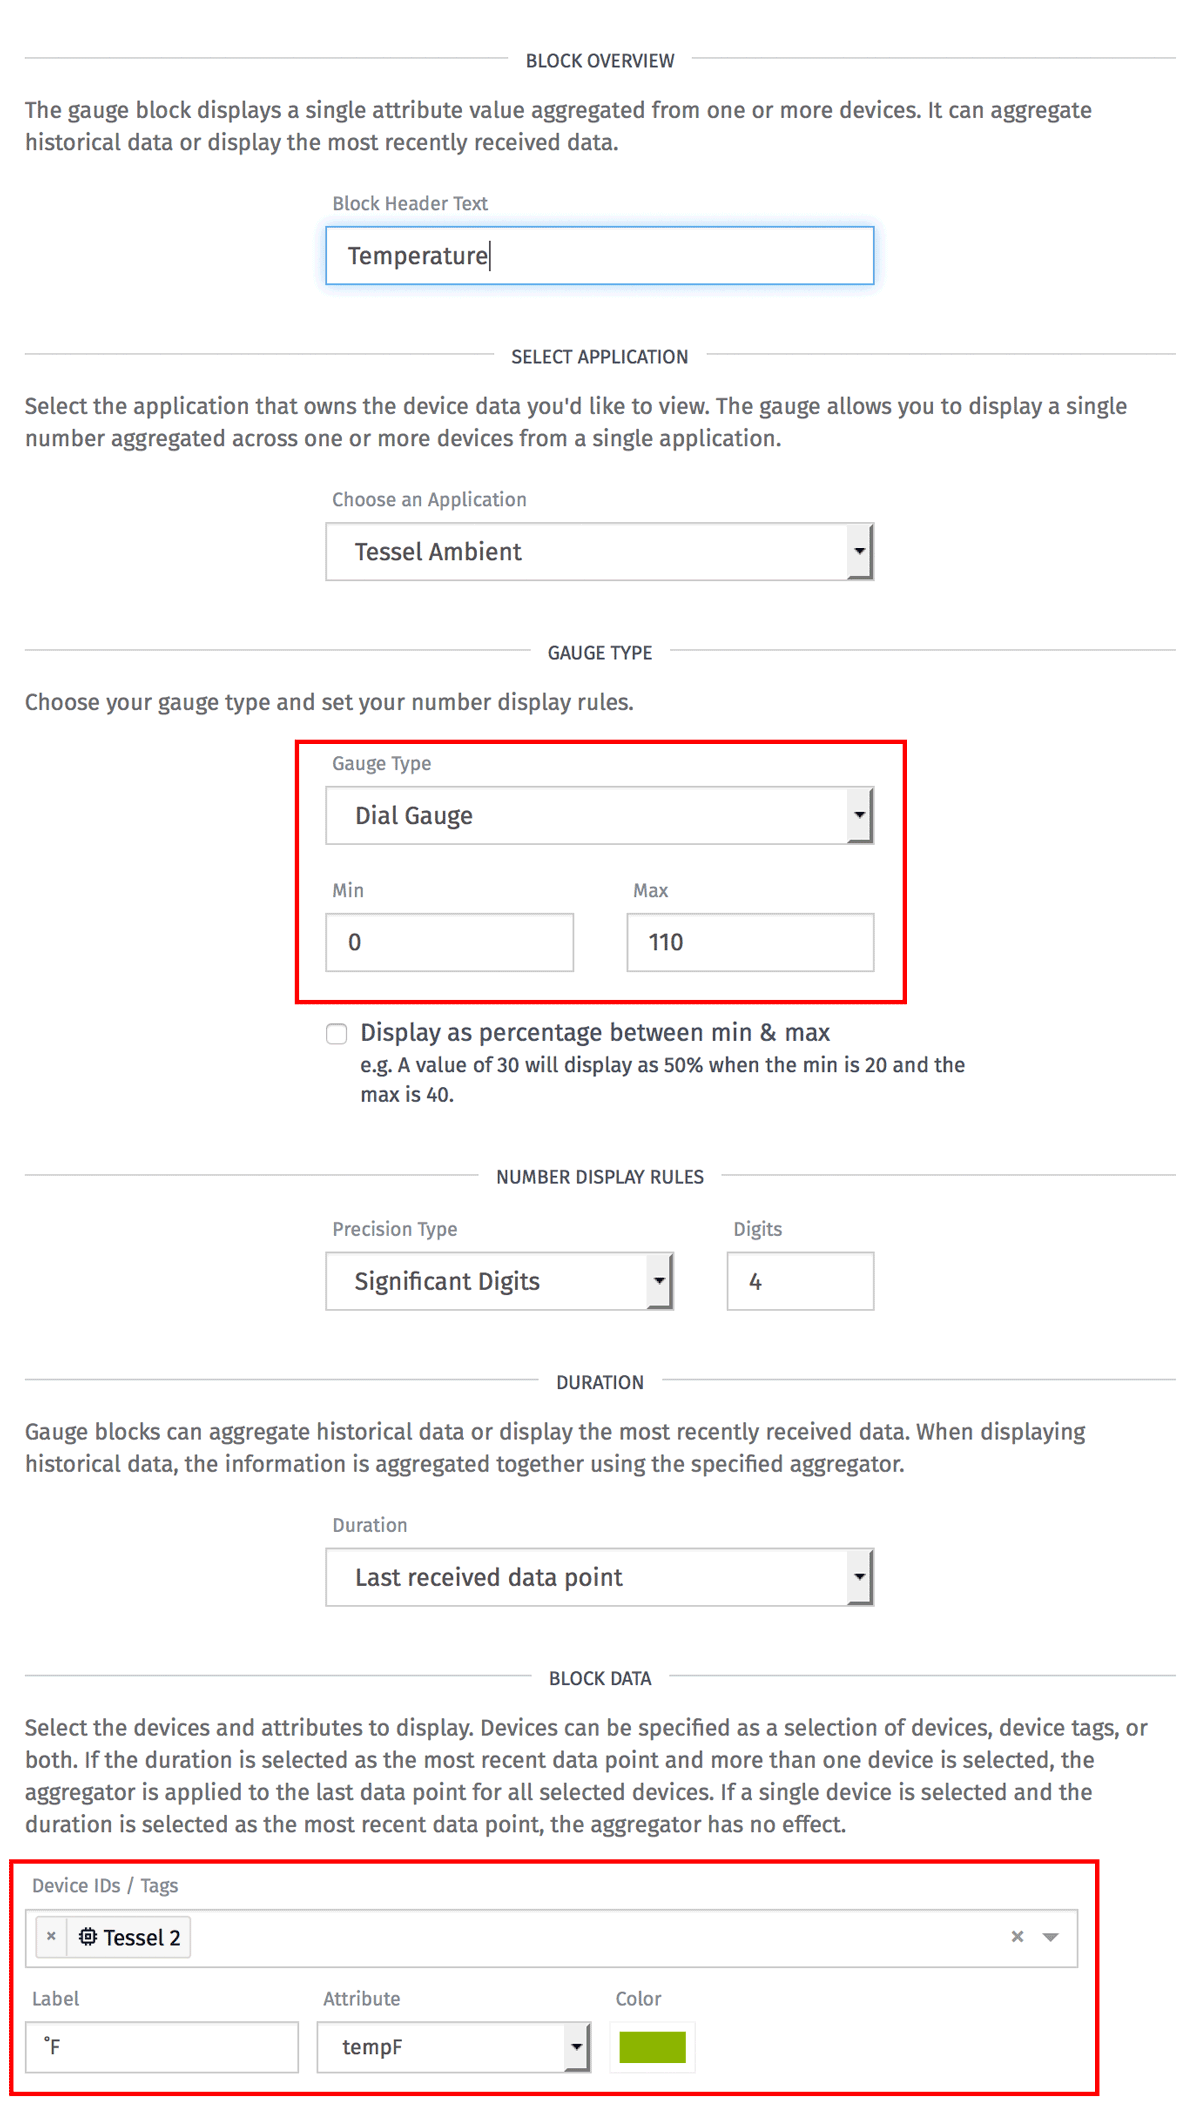
- Set the Gauge Type to "Dial" and set the minimum and maximum to temperature values that make sense for your region.
- Under Block Data, make sure your device is selected. Next, set the label to anything you'd like, and choose "tempF" or "tempC" as the attribute. Which attribute you choose depends on your preferred temperature units.
The preview should update immediately and display your dial gauge. When everything looks correct, click "Add Block" to add it your dashboard.
Repeat the same process again for the "humidity", "pressure", and "light" attributes. You can add a new block by clicking the green button on the top-right of the screen. Use the screenshot below for reasonable min and max values for each attribute.
Next, add a time series graph to show the temperature, humidity, and pressure over time.
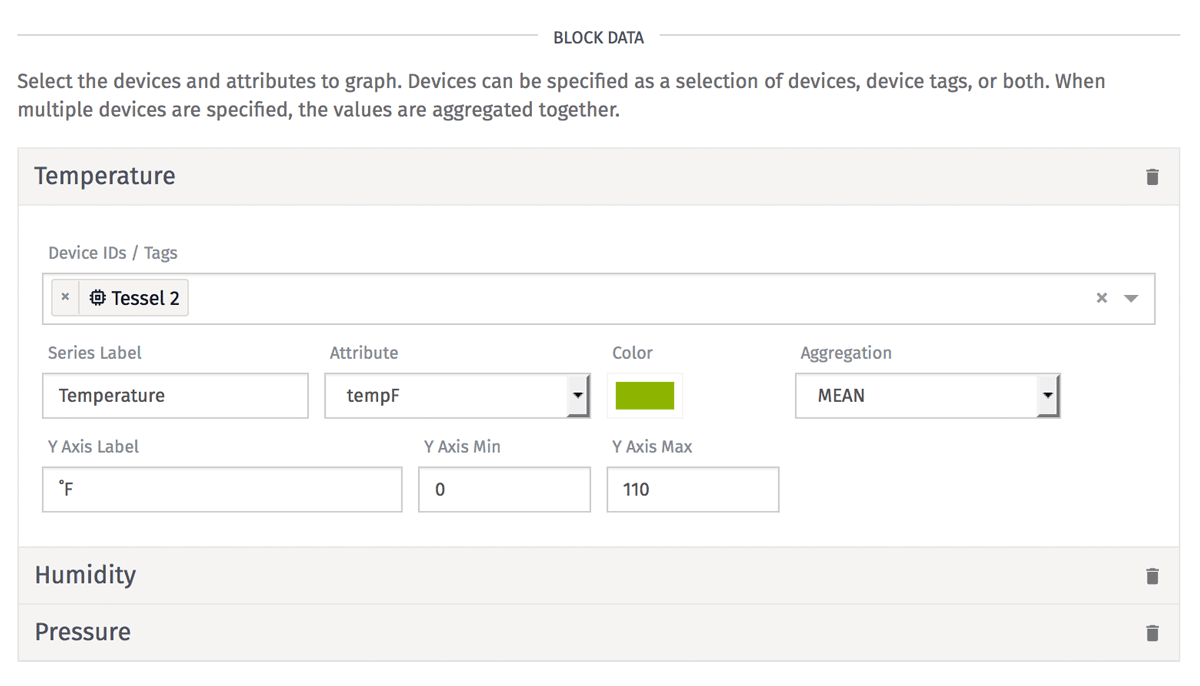
Add three series to your graph, one for each attribute. Set the colors, mins, and maxes to match the gauges you created earlier. When ready, click the "Add Block" button to add the graph to the dashboard.
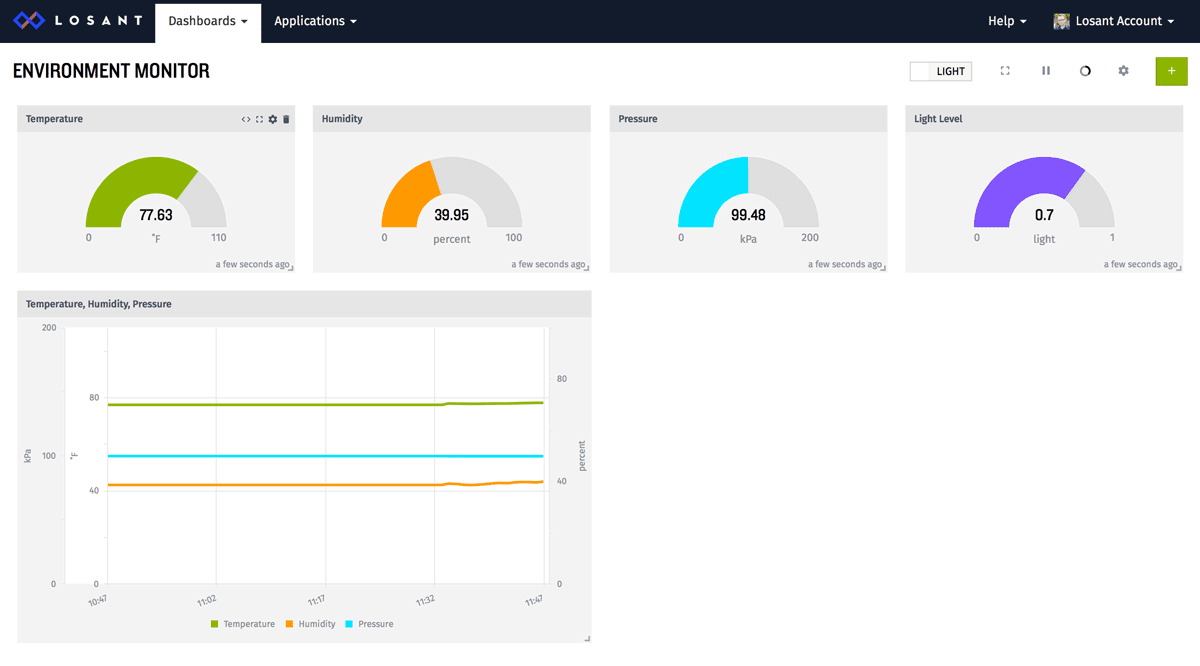
The last graph we'll add will display the light level. Add a new time series graph and add one series for the "light" attribute.
You now have a full dashboard showing the real-time and historical values for your indoor environment monitor. Feel free to continue exploring the dashboard features to configure the display in any way you'd like!