
Recently, we organized the first Losant Input/Output event; we helped a group of teenage girls create devices to monitor temperature and humidity in the Cincinnati Museum Center to help protect the exhibits. For this project, we used the ESP8266 NodeMCU and a DHT22 temperature and humidity sensor.

The DHT22 is a very low-cost sensor. It's made up of two components: a capacitive humidity sensor and a thermistor, which measures temperature. Because it's a digital sensor, you can read the sensor data over a GPIO pin.
In this tutorial, we'll look at how to connect the DHT22 to the ESP8266 NodeMCU.
Materials
Wiring
Once you have your materials together, we can wire it up.
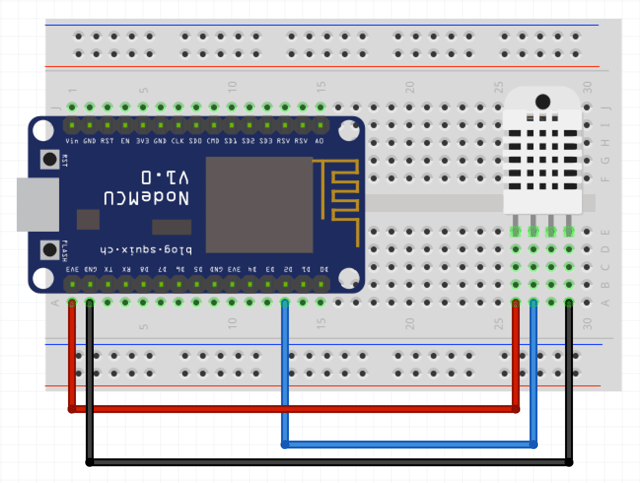
Here are the instructions in detail:
- Place the NodeMCU on the breadboard. The rest of the instructions assume the front ( with the holes ) of the DHT22 is facing you.
- The left-most pin of the DHT22 is the positive pin. You should connect it
to 3v3or Vinon the MCU. - The second pin of the DHT22 (from the left) is the data pin. You should connect it
to D2on the MCU. - The third pin of the DHT22 (from the left) does nothing.
- The last pin of theDHT22 (from the left) is the Ground pin. It should be connected
GND.

Setup
In this tutorial, to program the NodeMCU, we are going to use Arduino's IDE. It's the easiest way to get up and running with the DHT22.
First, you'll have to set up your machine: Environment Setup Instructions. These instructions take you through installing the IDE and the proper libraries.
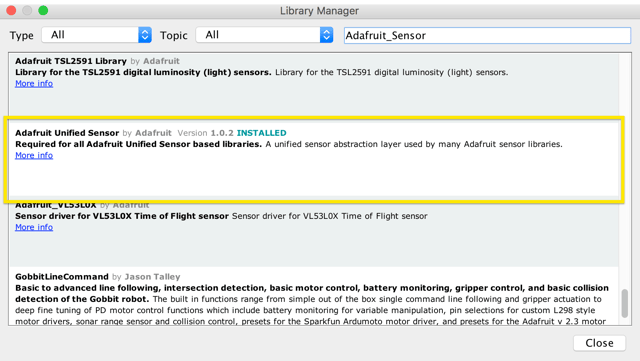
In addition to this, you'll have to install two more libraries. To read the sensor, we are going to use Adafruit's DHT22 library. It can be installed using Arduino's library manager. It comes in two components. First, you'll want to download the Adafruit Unified Sensor library:
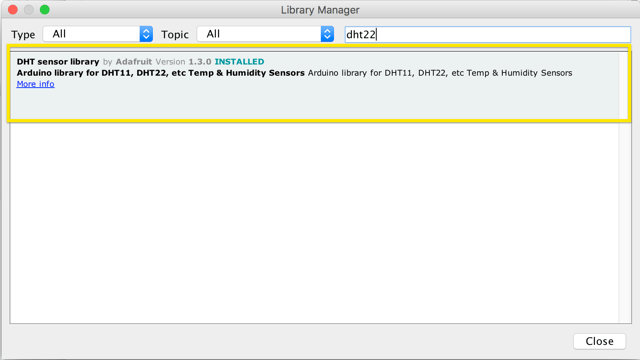
 Then, install the DHT sensor library:
Important: Lastly, you'll need to increase the underlying MQTT library's memory limit. The PubSubClinet MQTT library has a default memory limit that is not enough to support all the values that the DHT22 sensor can collect. The error is also not apparent, which makes it hard to track. To increase the memory limit, please check out this forum post.
Now were are ready to write some code.
Code
Note (April 2023): Several users following this guide have noted that newer versions of the Arduino ESP8266 library do not work when following this guide. It is suggested to use a legacy version of the library, such as 3.1.0. Choosing a version depends on your use case and your hardware.
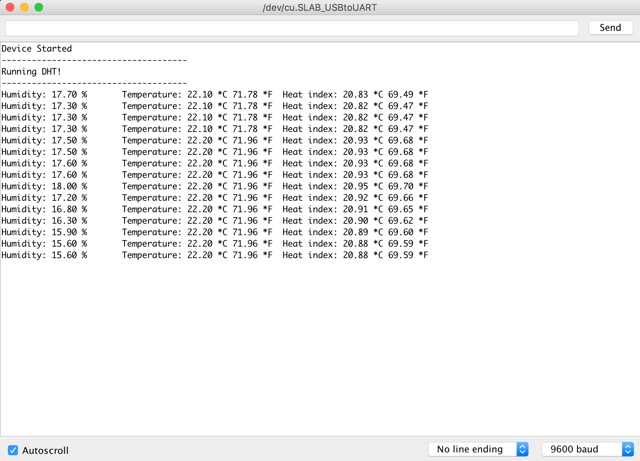
Here is a basic example of reading the sensor and logging the data to the serial monitor:
If you open up your serial monitor, you should see the data:
Now that we have the data let's send it to Losant.
Sending data to the Cloud
When just logging to the serial monitor, our data isn't that useful. Once in Losant, we can graph and react to the data. For example, we can send an SMS message if the temperature and humidity go out of range. Let's set this up:
Set up losant
1. If you don't have one, create a Losant account
2. Create a standalone Device - Make sure you save the Device ID.
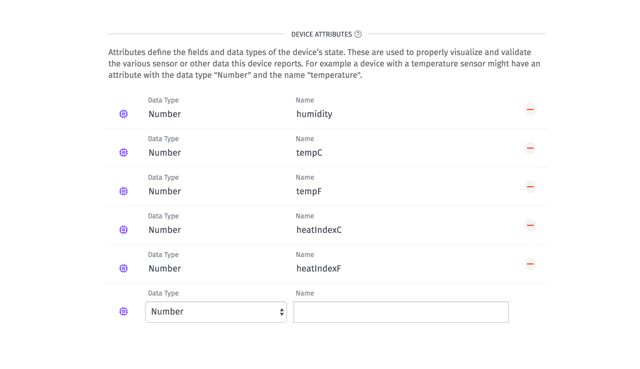
Set up five attributes of type number: humidity, tempC, tempF, heatIndexC, heatIndexF.
4. Create an Access Key and Secret - You should save these keys somewhere safe.
Code Pt. 2
We need to change up the previous program because now we need to connect to WiFi and Losant. In this example, we make the connections to WiFi and Losant, then report that data to Losant every two seconds.
Before you run, you need to update the config values:
- WiFi SSID
- WiFi Password
- Losant Device ID
- Losant Access Secret
- Losant Access Key
Now, if you open up your serial monitor, you should see it connect and report the data.
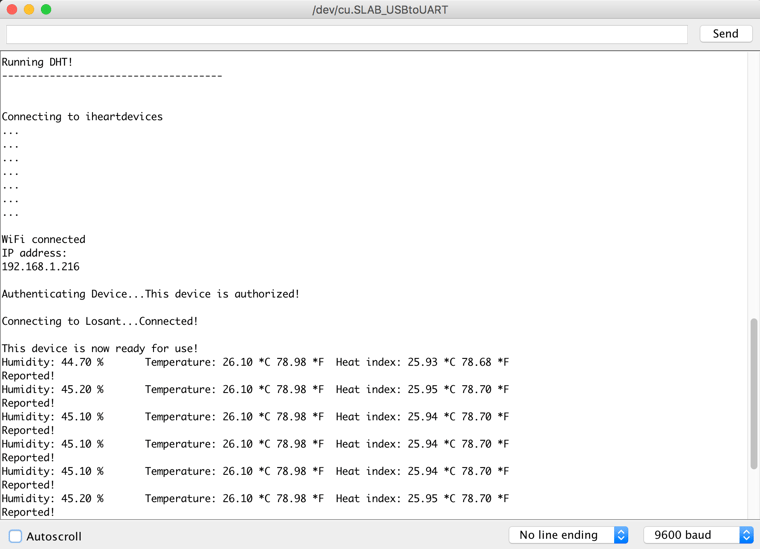
If you've having diffulty connecting the device to Losant, please check your Application Communication Log for detailed error messages.
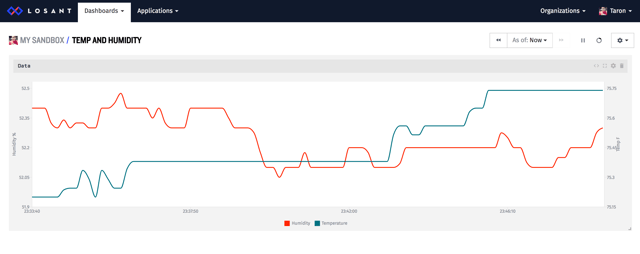
Visualize Temperature and Humidity Data
With Losant, in a few clicks, you can visualize the sensor data. To graph the temperature and humidity data, we just need to create a dashboard. Each dashboard is made up of smaller components called blocks.
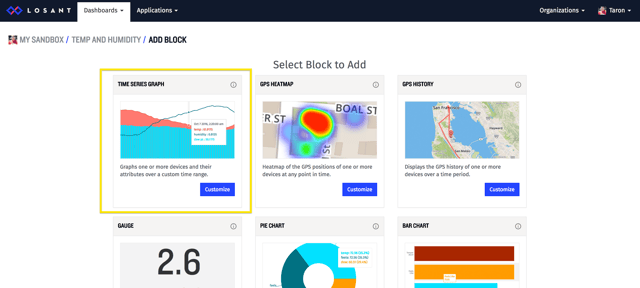
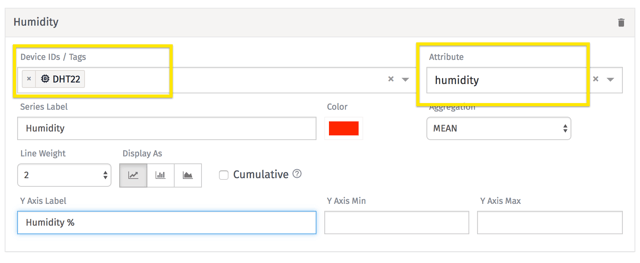
Let's create a block for humidity. For this example, we will use the Time Series Block.
In the block settings, choose the device that you created earlier, and you want to select the attribute called humidity.
We can also do the same for temperature.
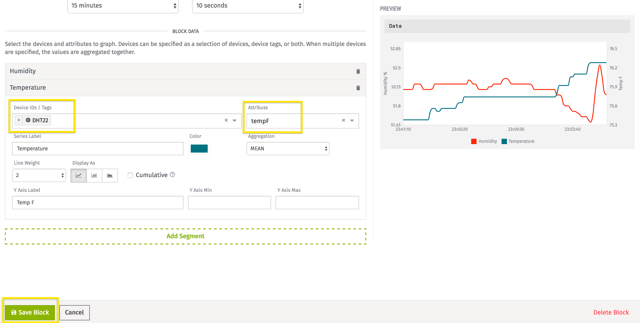
After you add the block to your dashboard, you can now see a graph of the ESP8266 reporting temperature and humidity. There are also more types of dashboard blocks that you can explore.
What's Next?
At this point, you are collecting and visualizing data. But, what about reacting to it? The next step is to build a Workflow in Losant to send yourself a text message whenever the humidity gets too high.
If you have any questions or feedback, let us know!