
This article was contributed by Kevin Sidwar. Kevin is an Internet of Things instructor and host of Daily IoT.
Were you that kid growing up who would try to open and close the fridge door really fast to see if the light really went out when the door was closed? It’s OK, we were all that kid. In this tutorial we’re going to create some hard evidence around that burning question using a Particle Photon, a simple photocell, and the Losant IoT Platform. Just for kicks (and because it’s really easy) we’ll also throw in temperature logging and a remote-activated buzzer to sound the alarm if the fridge temperature gets too warm.
Since Losant has a Particle Integration it’s simple to get sensor data from a Particle Photon into Losant where we can visualize it and build a workflow around it to visualize the data as well as create an alarm.
What You’ll Need
- Breadboard
- Particle Photon
- Photocell
- Piezo Buzzer
- 330-ohm resistor
- TMP36 sensor
- 7 jumper wires
- Particle CLI tools installed
Wiring The Photon
Take a few minutes to build the hardware using the following schematic.
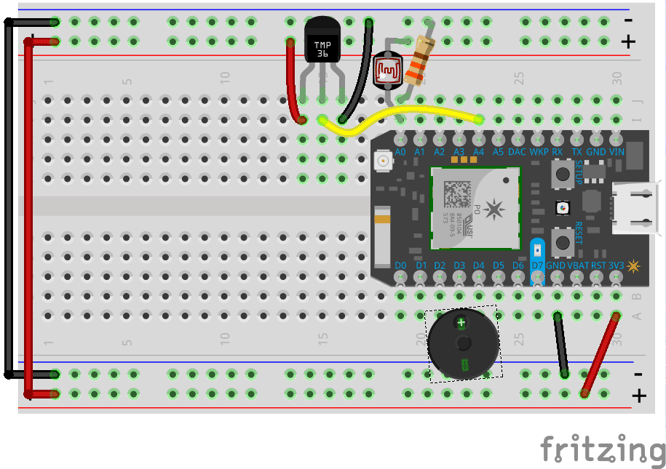
The photocell is connected between the supply voltage on the Photon and analog pin A0. The resistor is connected between A0 and ground creating a voltage divider with the photocell. This allows us to get a light intensity reading in our firmware.
The TMP36 sensor needs a connection to GND and 3.3V and the output can be connected directly to pin A4 of the Photon.
The Piezo Buzzer is simply connected between D3 and ground. That’s it for the hardware. Now we just need a little firmware code.
Writing the Code
Get It
The firmware for this example is available on GitHub. Open up your terminal and clone the project:
git clone https://github.com/sidwarkd/losant_fridge_watcher.git
Understand It
The Photon code is very simple and shouldn’t be too difficult to follow but let’s go over it briefly.
The two helper functions getTemperatureInCelsius and soundTheAlarm are pretty self-explanatory. One grabs the reading from the TMP36 sensor and the other supplies a tone signal to our Piezo Buzzer.
In the setup() function we configure the photocell and TMP36 pins to be analog inputs and also register our soundTheAlarm helper function as a Particle Function, which allows us to call it remotely using the alias “alarm”.
Finally, in the loop() function we take a light and temperature reading every 10 seconds until power is removed from our device. We publish this data to the Particle cloud, which will allow us to consume it in Losant.
Flash It!
Now that we know what’s going on in the code we can flash it to our Photon. Open a terminal window and navigate to the top of the cloned project folder. To flash the Photon you can simply use the command:
$ particle flash [your device name] ./
You will see your Photon LED flash through several different states as the code is updated over-the-air. Once it’s back to breathing cyan you are ready to move on.
Losant
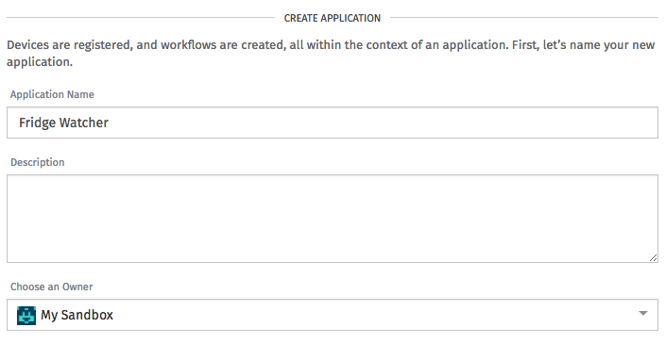
If you haven’t already, sign up for a Losant account and create an application named “Fridge Watcher”. The application contains the basic building blocks for our project like the Device, Workflow and Integrations we need.
Create a Device
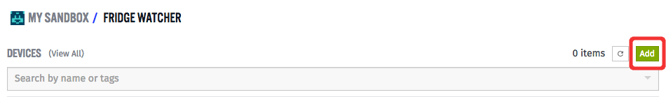
After creating the application we need to add a device using the following steps.
- From your application dashboard click the “Add” button by the Devices section.
- On the New Device page select “Create Blank Device”.
- Give the device a name and, optionally, a description. I named mine “Fridge Photon”.
- Select the Standalone Device Type
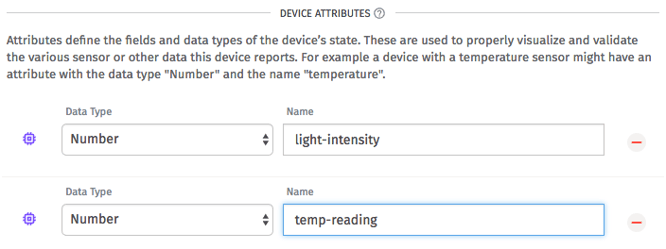
- Add a device attribute of type Number and name it light-intensity. This attribute will represent updates from our Photon device as it takes readings from the photocell.
- Add a second device attribute of type Number and name it temp-reading. This attribute will store temperature updates from our hardware.
- Click the “Create Device” button to save your new device.
Create an Integration
Before we can create workflow logic in Losant we need a way to get the light and temperature data from our Photon into Losant. That is accomplished with Integrations, and Losant has built-in support for Particle devices making it very simple.
Navigate to the Integrations tab and click “Add Integration”.
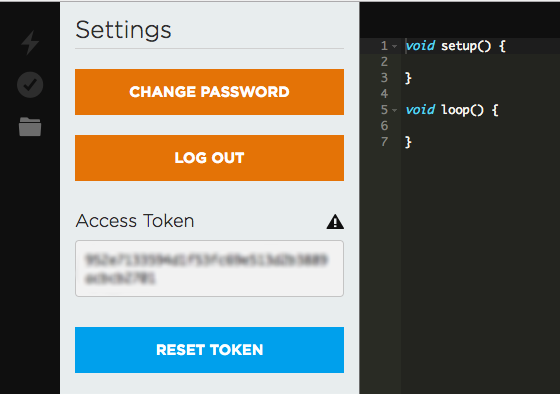
Name the Integration “Light Intensity” and select an Integration type of Particle. The page will then prompt you for several Particle-specific pieces of information. The only required item is your access token which you can retrieve from the Settings panel in the Particle Web IDE.
Optionally, you can also enter your device name, product ID, and organization ID. Finally, enter the event name we wish to trigger workflows on, which we set in our Photon firmware as “light-intensity”. Click “Create Integration” to save your changes.
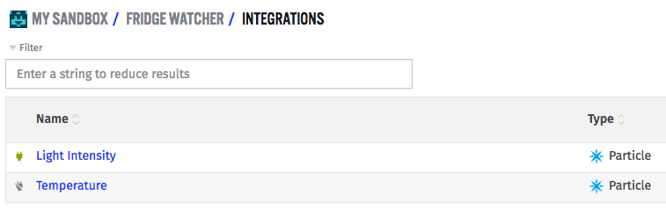
Repeat the process to create another Integration named “Temperature”. Remember that the event for temperature is called “temp-reading”.
Create the Workflow
At this point we have a physical device (Photon, sensors, and buzzer), a device (Fridge Photon in Losant) and some Integrations to capture events. Now we need a way to connect all of them together to do something meaningful. That’s the job of Workflows.
Navigate to the Workflows tab in your application and click “Create New Workflow”. Call it “Fridge Data Processing” and click “Create Workflow” to start working on it. Once created you will be dropped into the workflow designer where you can drag elements from the toolbox on the left onto the workspace in the middle. The right panel will show options for the various nodes you add to the work space.
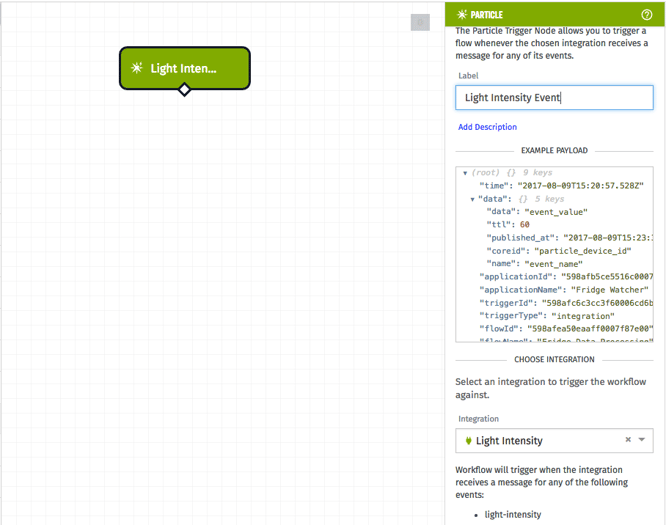
The first thing we need to do in our workflow is connect our integrations to our device so the data can correctly populate. To do that we’ll drag a Particle Trigger Node onto the workspace. You can find the Particle node under the Triggers section of the toolbox. As soon as you drop the node onto the workspace it will open an options pane on the right. Change the label to “Light Intensity Event” and select the “Light Intensity” integration. The options pane also shows you what the example payload will look like when the node is triggered.
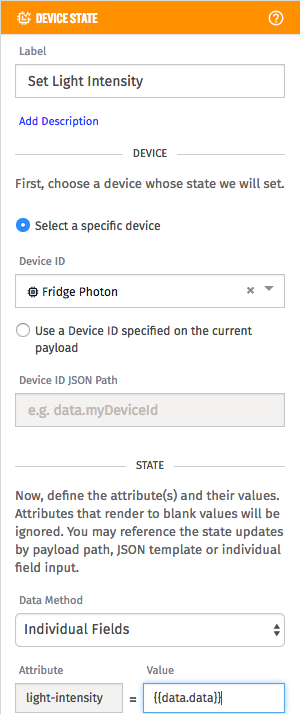
This node will be the starting point of our light intensity data through the workflow. Now that we have the event data we also want it to populate our device we created earlier. To do that we’ll drop a Device State node onto the workspace. You’ll have to scroll down the toolbox list under the Outputs section. Once on the workspace it will open an options pane for the new node. Change the label to “Set Light Intensity” and select your device from the dropdown. Under the State section we will have the payload assign the light-intensity attribute on the device by specifying the path to the data in the payload as data.data.
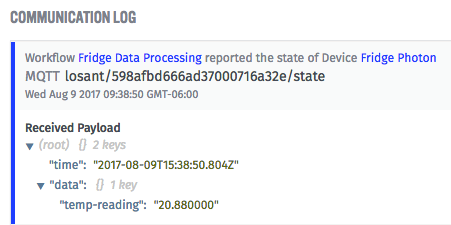
Remember, if you aren’t sure about how to specify the Value path you can always look at the Communication Log on your application dashboard to see the format of the incoming data.
The last thing we need to do is connect the workflow nodes. Simply click on the diamond on the “Light Intensity Event” node and drag the connecting line to the top of the “Set Light Intensity” node.
We’ll repeat this process to create a set of nodes for the temperature sensor readings. When finished our workflow will look something like this.
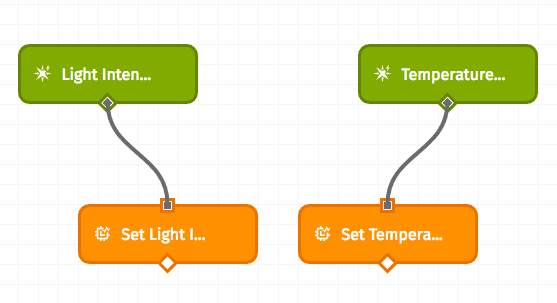
Before leaving the page, make sure to click the “Deploy Workflow” button at the top right.
To see our handiwork in action go back to the application overview and look at the Communication Log. With the Photon on you will see entries indicating that your workflow is reporting the state of your device.
Time for a Dashboard
Now that our device is getting updated by our real hardware we can start to visualize the data. Losant has you covered with extensive, customizable dashboards. Let’s put one together.
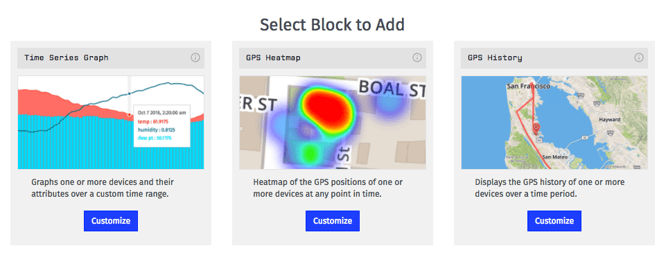
In the toolbar click on Dashboards->Create Dashboard. We’ll call the dashboard “Fridge Watcher”, and you can give it a description if you'd like. Immediately you’ll be taken to a screen that allows you to choose from a set of predefined blocks. We’ll start with the Time Series Graph by clicking on the “Customize” button.
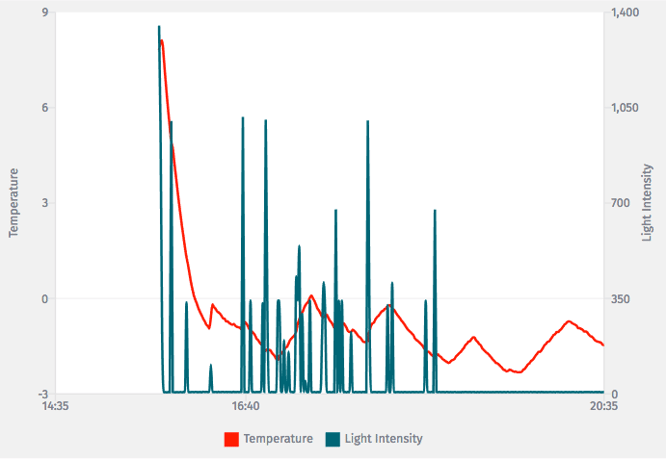
Setting up the graph is trivial. Give it a name, select the “Fridge Watcher” application from the dropdown, leave the Data Type as Historical and change the Duration to “One Point Every 10 seconds" since that is how often our Photon is reporting data. Finally under the Block Data section we’ll set the Attribute to temp-reading and modify any of the graph settings you want like plot line thickness/color or axis labels.
If the Photon is still powered on, the preview window will start graphing your data. At this point you have some decisions to make: You could create a separate graph for light intensity or even chart it on the same graph as temperature by clicking the “Add Segment” button.
Everything in the dashboard is customizable. To graph two values on a single graph you just have to specify a Y-Axis Label for each.
Add an Indicator
While graphing the light intensity is neat as an exercise it’s virtually useless in our application since it will either be zero when the door is closed or non-zero for short times when the door is open. It would be better if we could get the status of the fridge door at a glance. For that let’s add an Indicator Block to the dashboard. Simply click on the tool gear in the upper right corner of the dashboard and click “Add Block”. Scroll down and select “Customize” for the Indicator block type. Fill in the following settings:
- Block Header Text - “Door Status”
- Application - Fridge Watcher
- Duration - Last received data point
Under Block Data we create the following query to fetch the intensity.
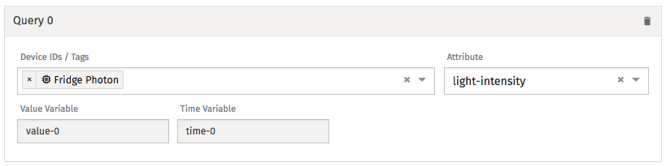
Then we add a couple of conditions to test against.
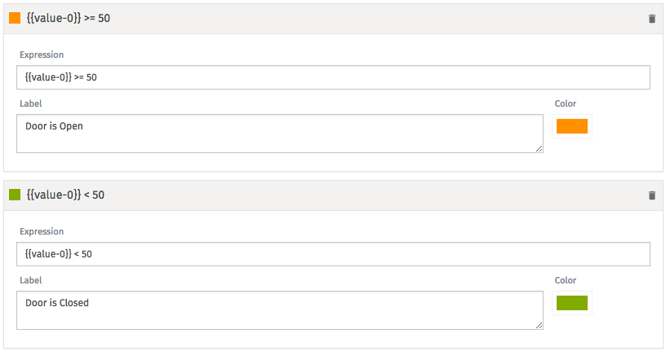
That may seem like some fancy hand-waving but it’s really pretty simple to understand. The query grabs the latest light-intensity reading from our virtual device and stores it as value-0 in the context of this block. We then use the conditions to check the value to see if it’s dark (light intensity < 50) to indicate the door is closed or open otherwise.
Click “Add Block” to add the new indicator to the dashboard. You can then cover the light sensor and uncover it to see the indicator change.
Temperature Gauge
Historical temperature readings might be useful for tracking your fridge’s performance over time and to see how it changes in relation to outside temperature and house temperature but it would also be nice to have an immediate gauge of temperature instead of extracting it from the graph line. No problem. All we need to do is add a Gauge block to our dashboard. Here are the settings:
- Block Header Text - Current Temperature
- Application - Fridge Watcher
- Gauge Type - Dial Gauge
- Min - -5
- Max - 10
- Significant Digits - 2
- Data Type - Live Stream
- Block Data - see image below
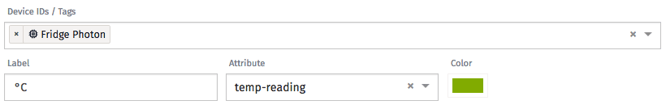
If you want you can even add conditions to change the color of the dial for certain value ranges.
Sound the Alarm
At this point we have a functioning application with a great dashboard to quickly see the status of our fridge while we are away. So far we have only shown how data can be sent into Losant for ingestion and processing, but it is also capable of communicating back out to our Photon device. To demonstrate this we’ll add a simple alarm that sounds the buzzer when the temperature gets above a defined threshold. The nice thing about this approach is that it’s not hard-coded in our firmware but easily adjustable from our Losant application.
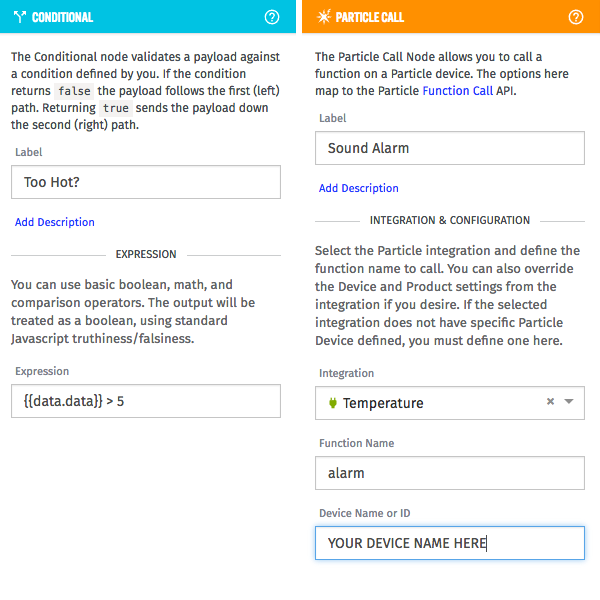
Adding this feature only requires a simple addition to our workflow. Back in our “Fridge Data Processing” workflow we will add a simple conditional check every time we receive a temperature reading. We do this by adding a Conditional node to the workflow. If the temperature is above 5°C (41°F) we’ll call a function in our firmware using the Particle Call output node in the workflow designer. Here is what the new workflow looks like:
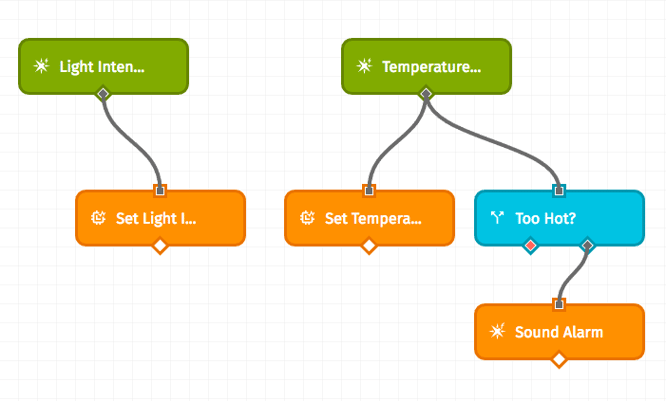
Also, here are the settings for the two additional workflow nodes:
Going Further
That’s it! Grab a battery pack and toss your Photon into the fridge and watch the data roll in. With less than 50 lines of Particle Photon firmware code and the power of Losant we were able to create a cloud application that ingests and makes decisions on sensor readings and displays that information to us in a dashboard. If you want to take the project a step further and learn more about the Losant platform here are some suggested bonus features:
- Add a humidity sensor and track its data on the dashboard
- Figure out how to count door open events by only using Losant without changing the firmware on the Photon
- Send yourself a text or email if the fridge gets too hot using the SMS or Email workflow node
- Create a slider input on the dashboard to change the threshold for sounding the alarm