
Downtime is the bane of any process engineer’s existence, but worse than just downtime is unplanned downtime. This can result in unhappy customers, processing or shipping delays, and missed deadlines. Not good for a business of any size.
I worked as a Process Engineer on a paper machine that manufactured toilet paper, and ensuring that the only downtime that occurred was scheduled and necessary was crucial to meet my deadlines. To manage and predict this downtime, I had to do a lot of work, including using multiple VPN connections, implementing machine monitoring software, and inputting data in homegrown Excel Spreadsheets. This was time consuming and not very efficient.
Fortunately, by using an application enablement platform such as Losant, the information I need to make these predictions is readily available. With Losant, I can calculate Overall Equipment Effectiveness (OEE) much quicker than doing so by hand.
Let’s take a look at Losant’s OEE features and see how they can help prevent downtime and provide the data your engineers and technicians need to make informed decisions.
What is OEE?
OEE stands for Overall Equipment Effectiveness and it indicates the percentage of time the machine is productive. To calculate OEE, you multiply the following three metrics together:
- Availability: Measures the amount of time the machine was down during planned production.
- Performance: Measures the amount of time the machine ran below standard speed.
- Quality: Measures the number of product defects and reworks.
Let’s take a look at each of those measurements in detail.
Availability
Availability is a measurement of the machine’s downtime. You find availability by dividing run time by planned production time. You can find run time by taking the planned production time and subtracting stop time, or time when the machine wasn’t running. The math looks like:
Availability = Run Time / Planned Production Time
Run Time = Planned Production Time – Stop Time
Both planned and unplanned downtime count against run time.
Performance
Performance measures any time the machine spent not running at maximum speed. You calculate performance by comparing the actual run rate with ideal run rate. The actual run rate is calculated by the amount of product created over a period of time. The ideal run rate is the speed the process can run under optimal circumstances. See the math below:
Actual Run Rate = Total Count / Run Time
Performance = Actual Run Rate / Ideal Run Rate
Performance should never go over 100%. If it does, that means the process is running faster than the machine has been proven to safely and effectively run.
Quality
Quality is the final metric of OEE and is also known as First Time Yield (FTY). Quality is the amount of product produced at standard (good count) compared to the total amount of product produced (total count). The good count is the number of products that are considered ready to be sold, and total count is the total number of products produced. See the math below:
Quality = Good Count / Total Count
How Do You Calculate OEE in Losant?
Using IoT-connected solutions in manufacturing puts important metrics, such as availability, at the fingertips of engineering teams. For a lead engineer with equipment at multiple sites and in several countries it’s important to be able to remotely compare all equipment in real time. After reviewing the data, these engineers can make an informed technical decision on where to focus their attention and provide the most support. They can also use the information to benchmark solutions and prevent failures across sites to increase the availability for the company as a whole.
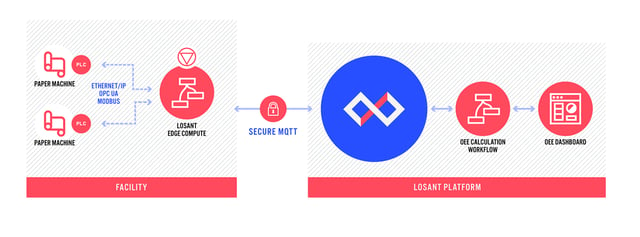
In Losant, this data is readily available on the dashboards. In a recent Platform Update, Losant added the Time At Value aggregation. This allows for the easy calculation and visualization of availability across multiple machines. It also provides a platform so you can track the reason behind the breakdowns.
In the example below, you can see the relatively low availability for a paper machine. The planned downtime is greater than the unplanned, which is good, but the machine is only running 80.24% of the time, which can be improved.
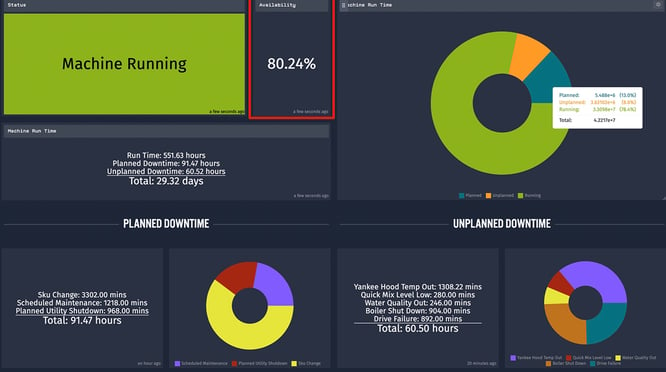
This information helps the process engineer see where the troubles with the machine lie and act appropriately. But what about performance and quality? Both rely on Total Count and having to choose between the two is often necessary. Losant can help your team make that decision as well.
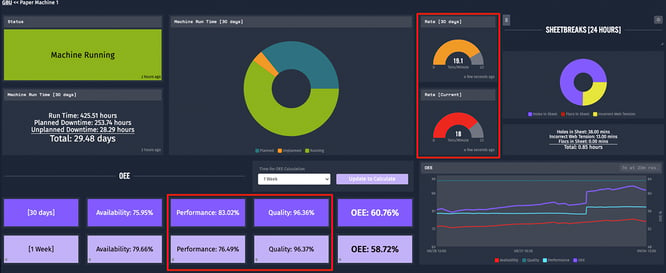
Looking at the OEE section of the dashboard image below, Losant shows that performance over the last week has dropped but quality has not changed. The current production rate (18 Tons/minute) is 1.1 Tons/minute lower than the overall production rate for the month. In this instance, you can increase the rate of the machine because the data shows that the decrease in speed did not directly affect the quality.
In the next image, two things have changed. The rate of the machine has been brought to max speed, and the OEE was calculated for the last day. As you can see, not only is the performance up, but so is the quality.
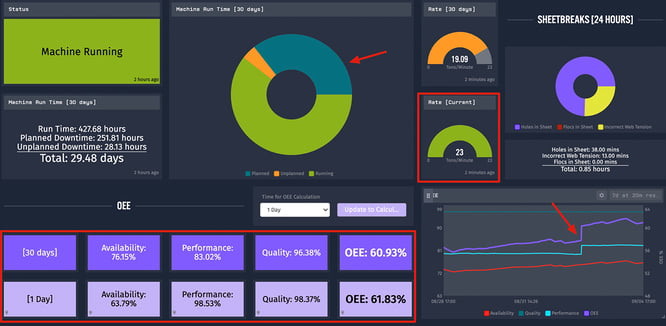
Normally a speed change that drastic wouldn’t happen at once, but slowly, so that quality can be monitored in order to find the perfect balance. Losant provides the tools to monitor these changes in real time, allowing you to make the correct decision for your business.
OEE is calculated inside of the Losant Visual Workflow Engine. The separate metrics, availability, performance, and quality are all saved as an attribute to each device. These attributes are displayed in indicator blocks on the Losant dashboard. You can see an example of this workflow in the OEE Application Template.
How Can I Start Measuring Oee for My Own Products?
To ease the transition into developing your own OEE calculations, Losant added a new OEE Application Template that, like the rest of our Application Templates, offers an example that you can use to kickstart your own thinking and development. Because OEE is a process-driven calculation, every implementation is slightly different. This template can be used to guide your thinking and help you implement your own solutions.
In the OEE template, paper machines, similar to the ones I used to manage, are simulated using workflows.
In the template, each metric of OEE is calculated separately and attached to a device attribute. This helps you measure the different data points and see the information you need at a glance. It also allows you to track the changes to your OEE over time. By implementing similar solutions in your own environment, your team can measure OEE too.
Read more about the OEE Application Template in the README.
OEE in Losant
OEE is a valuable tool for manufacturing teams looking to increase their overall productivity and effectiveness, and Losant includes built-in functionality to ease that burden. By using Losant, your team can reap the benefits of OEE easier than ever before.
Try the OEE Application Template for yourself now in the Losant Developer Sandbox and watch our Deeper Dive Webinar on the topic.